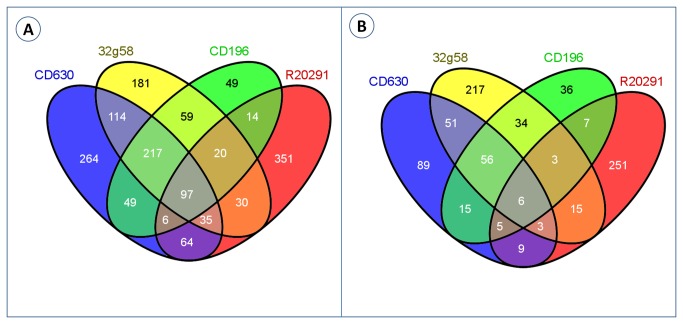
Figure 2. Venn diagram comparing differentially expressed core genes across C. difficile strains.
Core genes in each strain were determined by applying orthoMCL clustering across publicly available C. difficile genomes. When compared to control, genes with log ratio ≥ 1.5 and FDR- adjusted p value less than or equal to 0.05 were considered as differentially expressed. Panel A – differentially expressed core genes under nutrient shift (Shift from Brain heart infusion broth to Basal defined medium). Panel B - differentially expressed core genes under osmotic shock(shift from Brain heart infusion broth to Brain heart infusion broth supplemented with 1.5% NaCl).

