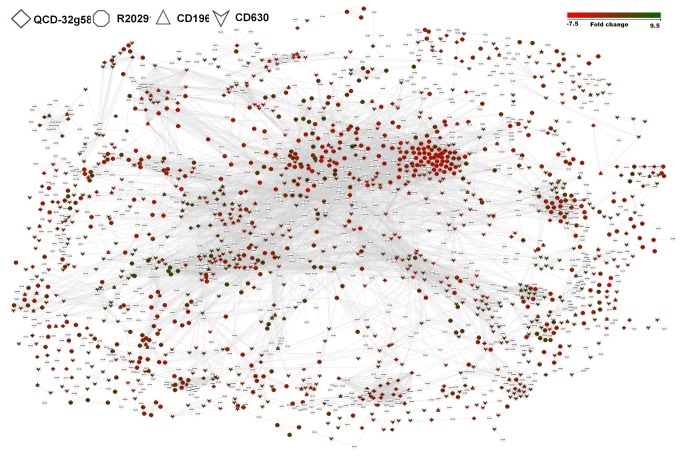
Figure 4. Differentially expressed genes under nutrient shift mapped to C. difficile interaction network.
The shapes of the nodes denote strains as per the scheme given on top left hand side. The color of the code represents expression fold change. Scale of the fold change is given on top right hand side of the figure.

