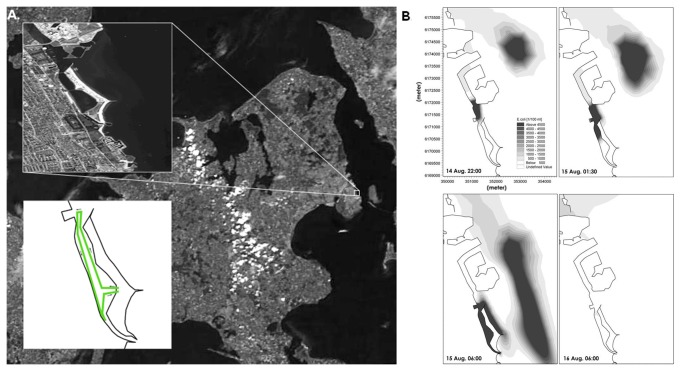
Figure 1. The modelled concentrations of E. coli in the coastal area east of Copenhagen, August 2010.
Panel A shows a satellite photo of the Danish island of Zealand including the Copenhagen area, where the swim course took place in a coastal lagoon. The swim route is shown in green. Panel B shows the modelled concentrations of E. coli in the lagoon and surrounding area in August 2010 at: a) 10:00 p.m. 14 Aug, b) 1:30 a.m. 15 Aug, c) 6:00 a.m. 15 Aug (shortly before the competition began), and at d) 6:00 a.m. 16 Aug. CSO124 indicate the sewage overflow discharge point and WWTP the bypasses from the waste water treatment plant.

