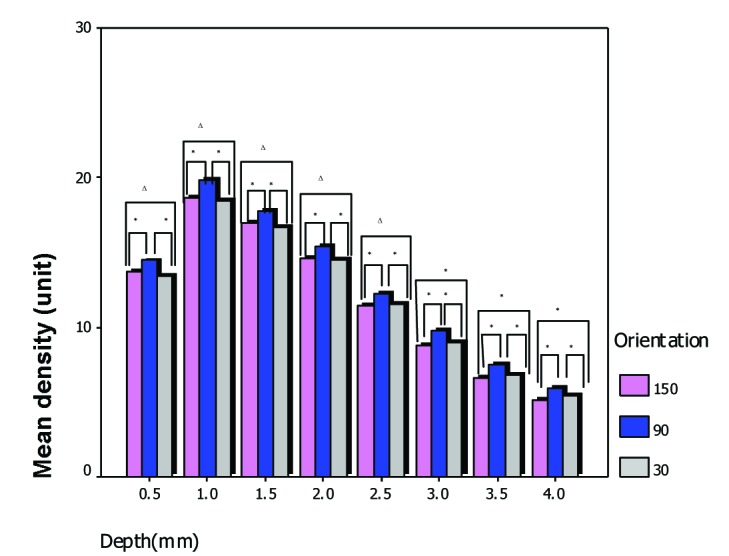
Figure 5.

Mean density of the three orientation groups at various depths of the optical axis. At 90º, the mean density value was slightly larger (P<0.05). No significant difference in density value was noted between the 30 and 150º groups prior to the 3-mm depth point. *P<0.05, ΔP>0.05.
