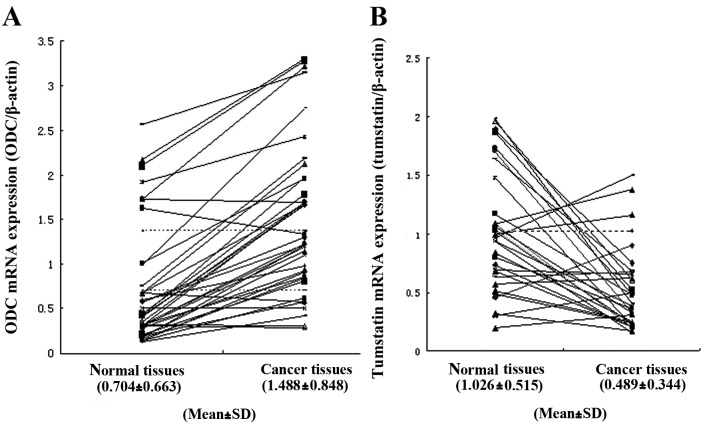
Figure 1.
mRNA expression levels of ODC and tumstatin in renal tissues. (A) ODC mRNA expression level measured by RT-PCR. Band intensities were quantified and normalized to the intensity of the β-actin signal. The dashed lines indicate the mean and mean + SD levels. (B) Tumstatin mRNA expression level in ODC-overexpressing renal cancer tissues. The dashed line indicates the mean level.

