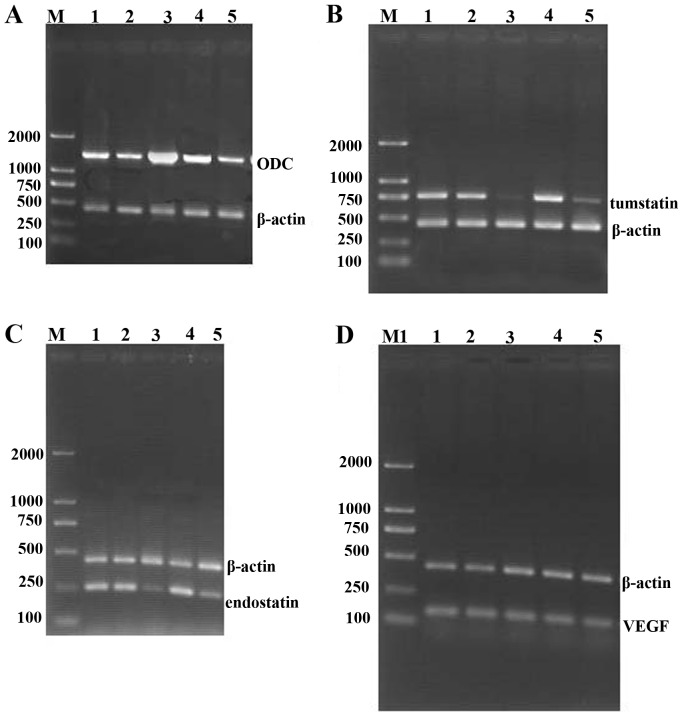
Figure 3.
mRNA expression of ODC, tumstatin, endostatin and VEGF in HEK293 cells after treatment. (A) A 1,286 bp band representing the ODC gene, (B) a 750 bp fragment representing the tumstatin gene, (C) a 261 bp fragment representing endostatin and (D) 156 bp fragment representing VEGF were amplified by RT-PCR and visualized. β-actin was also amplified as an internal control. Lane M, DL-2000 marker; lane 1, PBS-treated group; lane 2, mock transfectants; lane 3, ODC transfectants; lane 4, ODC transfectants transfected with pcDNA-ODCr; lane 5, putrescine-treated group.

