Abstract
Purpose: An improved method of image guidance for lung tumor biopsies could help reduce the high rate of false negatives. The aim of this work is to optimize the geometry of the scanning-beam digital tomography system (SBDX) for providing real-time 3D tomographic reconstructions for target verification. The unique geometry of the system requires trade-offs between patient dose, imaging field of view (FOV), and tomographic angle.
Methods: Tomosynthetic angle as a function of tumor-to-detector distance was calculated. Monte Carlo Software (PCXMC) was used to calculate organ doses and effective dose for source-to-detector distances (SDDs) from 90 to 150 cm, patient locations with the tumor at 20 cm from the source to 20 cm from the detector, and FOVs centered on left lung and right lung as well as medial and distal peripheries of the lungs. These calculations were done for two systems, a SBDX system and a GE OEC-9800 C-arm fluoroscopic unit. To evaluate the dose effect of the system geometry, results from PCXMC were calculated using a scan of 300 mAs for both SBDX and fluoroscopy. The Rose Criterion was used to find the fluence required for a tumor SNR of 5, factoring in scatter, air-gap, system geometry, and patient position for all models generated with PCXMC. Using the calculated fluence for constant tumor SNR, the results from PCXMC were used to compare the patient dose for a given SNR between SBDX and fluoroscopy.
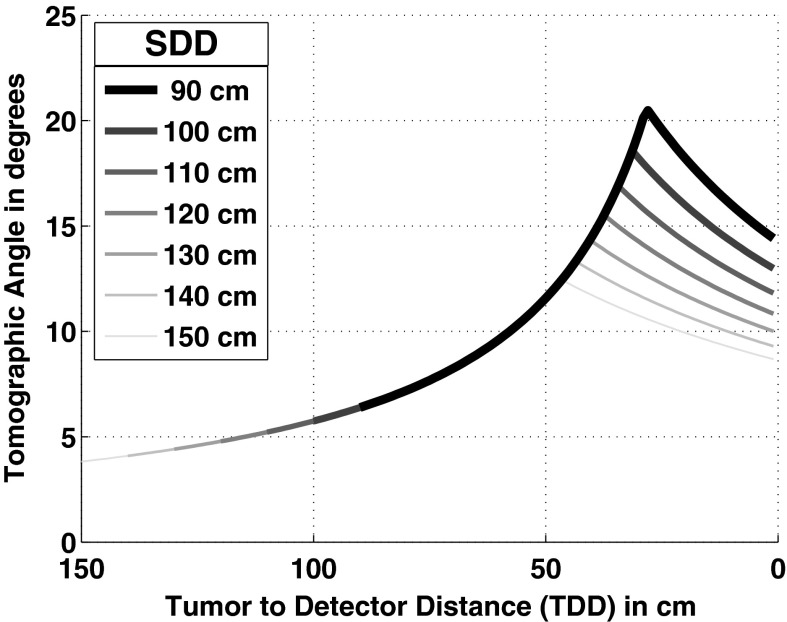
Results: Tomographic angle changes with SDD only in the region near the detector. Due to their geometry, the source array and detector have a peak tomographic angle for any given SDD at a source to tumor distance that is 69.7% of the SDD assuming constant source and detector size. Changing the patient location in order to increase tomographic angle has a significant effect on organ dose distribution due to geometrical considerations. With SBDX and fluoroscopy geometries, the dose to organs typically changes in an opposing manner with changing patient location. When tumor SNR is held constant (i.e., x-ray fluence is scaled appropriately), SBDX gives 2–10 times less dose than fluoroscopy for the same conditions within the typical range of patient locations. The relative position of the patient (as a percent of SDD) has a much more significant impact on dose than either SDD or patient position. The patient position providing the minimum dose for a given tumor SNR and SDD is approximately the same as the position of maximum tomographic angle.
Conclusions: SBDX offers a significant dose advantage over currently used C-arm fluoroscopy. The patient location with lowest dose coincides with the location of maximum tomographic angle. In order to provide adequate space for the patient and for the pulmonologists’ equipment, a SDD of 100 cm is recommended.
Keywords: tomosynthesis, dosimetry, modeling, low-dose, image-guidance
INTRODUCTION
The increased use of low-dose CT in cancer screening has led to an increase in the discovery rate of lung nodules, and a concomitant increase in the number of lung tumor biopsies performed each year.1 The main approaches to biopsy are thoracotomy, percutaneous lung biopsy, and transbronchial needle biopsy (TBNbx).2 TBNbx is preferred as it has the advantages of being minimally invasive, safer, and less painful to the patient.3, 4, 5, 6, 7 Additionally, TBNbx incurs a very low rate of pneumothorax in comparison with other methods, particularly percutaneous lung biopsies. TBNbx is performed with an endoscope which is navigated through the bronchial tree with the assistance of image data from a previously acquired CT scan, helping to pinpoint the nodule location.8 Some pulmonologists are willing to use TBNbx on nodules in the lung periphery, down as many as seven generations of the bronchial tree. However TBNbx requires the extraction of multiple samples, each of which must be individually inspected for cancerous cells, because false negative rates are generally high.9, 10 The true positive and false negative rates vary with user experience, nodule size, and location.
Currently, electromagnetic navigation bronchoscopy (ENB) guidance systems provide three-dimensional tracking of a probe within the bronchoscope. Placement of a thin array of coils beneath the patient enables RF triangulation of the probe location, which is subsequently superimposed on a CT image in order to assist with guidance of a biopsy needle to the tumor location.11, 12, 13 While this is a valuable technique, it is limited by the use of a prior CT scan that is acquired during a patient breath hold, which may not reflect the breathing pattern associated with anesthetized patients undergoing the procedure. Additionally, because the ENB operates by using the probe in the working channel of the bronchoscope, the probe must be removed to allow the working channel to be used for the biopsy itself. Thus, there is no ENB guidance at the moment of biopsy. To mitigate the lack of guidance during biopsy, C-arm fluoroscopy is used. While this currently does not enable visualization of the tumor, it does allow visualization of the needle and bronchoscope relative to the ribs and thus puncturing the pleura is avoided.
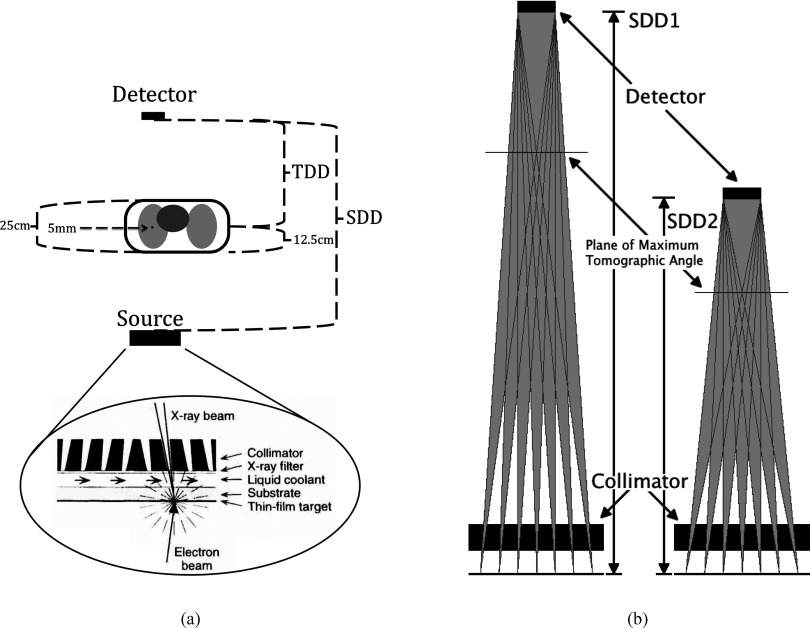
To address the problems described above, we are investigating the use of an inverse geometry scanned beam digital x-ray system (SBDX) created by Triple-Ring Technologies, Inc. (Newark, CA) for real-time 3D tomosynthesis imaging of the lung. The SBDX system was originally designed as a low dose alternative to c-arm fluoroscopy during cardiac interventions. While it was not designed to be a tomosynthetic system, it has the capability to perform tomosynthesis at a very high speed. In the SBDX system, the electron beam is scanned over a thin, large area transmission anode, and the resultant x-rays pass through a 100 × 100 hole collimator, which shapes and angles the beamlets to a small, very fast cadmium telluride detector (Fig. 1). A traditional x-ray tube's reflection anode's angle puts a limit on the FOV. The transmission anode of the SBDX system creates nearly isotropic x-rays and the collimator limits the fluence emitted to only those photons directed to the detector. The small beamlet size and the air gap results in much lower scattered radiation than a normal fluoroscopic c-arm. The SBDX system acquires thousands of projections from different angles in a fraction of a second, which is theoretically sufficient for real-time tomosynthesis. The FOV for a given plane in the SBDX system has dimensions of (10.7 + 12.3 cm × TDD/SDD) by (5.5 + 17.5 cm × TDD/SDD), where TDD is the tumor-detector-distance and SDD is the source-detector-distance. The pixel pitch is ∼0.22 mm, which limits in-plane resolution of the system a maximum of 2.2 lp/mm.14 The through-plane resolution depends on the tomosynthetic angle.15 The system could provide real-time, 30 frames per second tomosynthesis reconstructions of the biopsy tool as it enters the nodule, in order to verify needle location, which could reduce false negative rates, and shorten overall procedure times.
Figure 1.
(a) Diagram of the SBDX system to scale. An electron beam is magnetically deflected to raster across a transmission, thin film anode. The collimator has 100 × 100 holes. The distances shown are source-detector-distance (SDD), tumor-detector-distance (TDD), tumor depth in patient (12.5 cm), patient thickness (25 cm), and tumor thickness (5 mm). (b) To achieve a greater maximum tomographic angle on the system a new collimator can be designed for a smaller SDD.
Our previous human and numerical observer study of nodule detectability found that detectability could be improved from 80% (for standard projection images) to 96% by using a tomographic angle of only 3°.14 At 3°, the “section thickness,” or the thickness of the section that is in focus in the tomosynthetic image, is approximately 22 mm.15 The larger the tomosynthetic angle, the better tumor visualization in 2D, and the thinner the section thickness, which provides improved 3D spatial location. Section thickness is inversely proportional to the angle, so even moderate increases in the angle can greatly decrease the section thickness. At an angle of 10° the slice thickness is approximately 7 mm.15 The tomosynthetic angle on our system can potentially be increased in several ways. In a mechanically stationary SBDX system, the available options are to change the source array size, the detector size or the SDD. Increasing the source array size would necessitate a costly redesign of the source as well as a new source collimator for the modified geometry. Increasing the detector size is also very expensive, with further cost incurred through the requirement of a new source collimator. Decreasing the SDD is more economical, because this alternative requires only a new collimator, while both source and detector can remain unchanged.
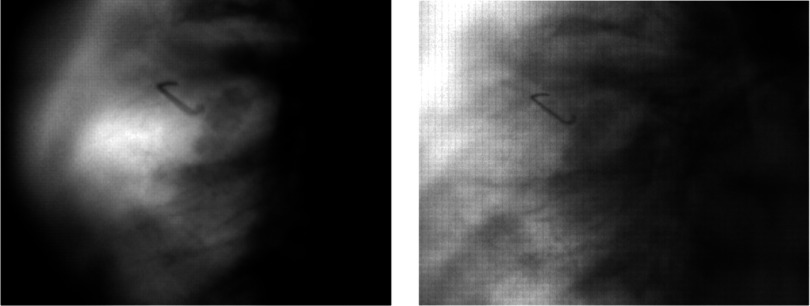
Figure 2 shows the effect of moving the patient closer to the source (and thus decreasing the tomosynthetic angle) on the image quality. A large TDD (as the SBDX was originally designed to have) results in a greater air gap, which reduces x-ray scatter while allowing the dose to be spread over a greater entrance area and volume of the patient. However, in order to achieve larger tomographic angles, the patient should be closer to the detector, which increases both patient dose and scatter. Thus while the imaging task drives toward a larger tomosynthesis angle for improved targeting accuracy, the concomitant increase in dose and scatter must be evaluated in order to determine the optimum design and operating parameters for the system. We have therefore investigated the effects of SDD and TDD on patient dose and tomographic angle for a desired target lesion SNR.
Figure 2.
SBDX images of a lung tumor phantom. Both acquired with 150 cm SDD. The left image has the tumor 100 cm from the source (thus having a maximum tomographic angle of 11.35°); the right image has the tumor at 50 cm from the source (with a maximum tomographic angle of 5.69°).
In addition to these parameters, we also account for the interaction of the SBDX system with the ENB tracking system. Because the ENB works by EM triangulation, it is very sensitive to EM interference from nearby electronics. Tests were conducted to quantify that effect.
Previous work has demonstrated detailed quantification of the dose of digital tomosynthesis systems that use simple 1D motions.16, 17 The doses from these systems were compared to those from projection x-ray systems, with the result that because of the geometric distribution of the organs and their varying sensitivities, the dosimetry is not a simple linear extrapolation of the traditional projection x-ray system. In this work, we give detailed quantification of our 2D array tomosynthesis system. The relationships between SDD, TDD, SNR, and tomographic angle are determined by calculating the maximum tomographic angle for a variety of patient locations and SDDs. The Rose Criterion18 is used to derive an equation for beam fluence given the minimum desired SNR of 5 and the system geometry. Using the calculated beam fluence required to achieve a SNR of 5, a Monte Carlo simulation is run to determine the dose to various organs and the overall effective dose. Finally, we compare our simulated SBDX system to a fluoroscopy system currently used to guide the biopsy during ENB procedures.
METHODS
ENB compatibility
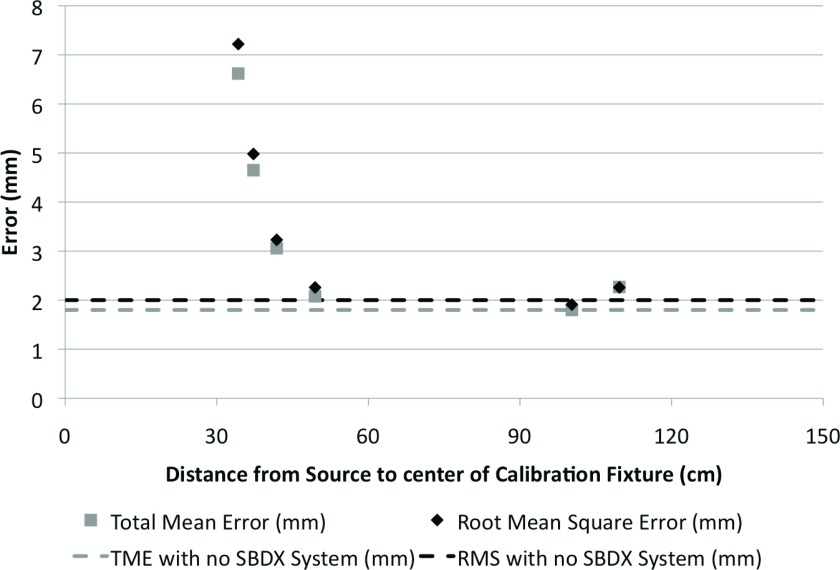
The bed and EM transmitter pair were placed such that they were center-aligned with the SBDX source. To quantify the distortion introduced by the SBDX system (especially from metal components of the SBDX system), the ENB system calibration fixture and ENB system calibration measurement values were used. In the calibration fixture 20 positions in three different planes successively signal position to the ENB system for 4 s to find the error in system accuracy. (Fig. 3) First, the ENB calibration fixture was located as close to the source as the bed would allow. A 20-point ENB tracking calibration routine was performed; for each point, a 4-s 30 Hz sampling (i.e., 120 samples) of the position were recorded internally. Overall root mean square (RMS) error and total mean error (TME) were computed by the ENB system and were recorded. Additionally, mean errors for each of the 20 points used in the calibration were also recorded. Next, the ENB calibration fixture and the EM transmitter were translated away from the detector toward the source, the calibration was repeated and the RMS and total mean errors were recorded. Calibrations were performed at four different locations by translating vertically away from the source. Then, the fixture and transmitter pair was translated vertically to the detector “fork” as close as was feasible and the calibration was repeated.
Figure 3.
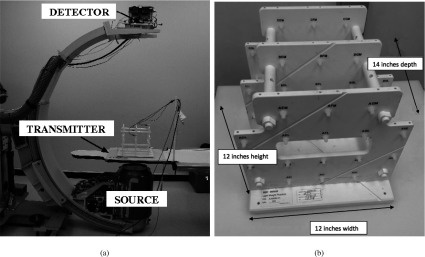
(a) SBDX system source and detector, and the ENB system transmitter are indicated. (b) The ENB calibration fixture, seen in Fig. 3a on the ENB transmitter. It is used to find the measurement error of the ENB system.
Beam fluence derivation
To quantify the patient dose and find its relationship to TDD and SDD, and to compare the results of the SBDX system and fluoroscopy, x-ray fluence needs to be normalized between SBDX and fluoroscopy. Normalizing by selecting a given x-ray fluence does not consider the differences in image quality, which are fundamentally different due to the different image production approaches. In this study, the images from the SBDX system are treated as though they are simple 2D radiographs. This is a conservative assumption as we have previously shown that even a small tomographic angle improves nodule detection, and we know that in general, detectability increases with increasing tomographic angle. If the image characteristics of the SBDX system were compared against a different tomographic system, then the detectability of the reconstructed images would have to be compared. Here, clinical 2D fluoroscopy is compared with a tomographic system assuming both function as 2D imaging systems, and dose was normalized to provide a constant tumor SNR at the detector. An equation was derived to find the beam fluence for a given TDD, SDD, and target SNR. Then using this fluence, TDD, and SDD, the effective dose was calculated using a Monte Carlo model.
To normalize the fluence for the various geometries of the SBDX system, we calculated the minimum fluence necessary to visualize the tumor. For this calculation the variables are measured at the detector unless otherwise specified.
It is assumed that at minimum detection conditions, the following minimum criterion is true
| (1) |
where is the variance of the tumor signal, is the variance of nontumor tissue in the projection, and σ2 is the generic variance of the projection. We define the area of interest (for both our measured signal and our measured background) as the area (A) of the tumor projected to the detector. Given the following definitions for SNR and Contrast (C):
| (2) |
| (3) |
where NB and NS are the photon counts of the background and signal, respectively, and assuming Poisson statistics,
| (4) |
where ϕ is the fluence (cm−2), and A is the area of the tumor projection measured at the detector, an equation can be derived to find the background fluence required to achieve a desired tumor SNR. Combining Eqs. 2, 3, 4,
| (5) |
Persliden and Carlsson19 created and verified a model of the scatter-to-primary ratio as a function of beam size and air gap. For a particular scatter-to-primary ratio, the degradation of contrast is given by
| (6) |
where CP is the contrast of an image with only primary photons (no scatter). The primary contrast is
| (7) |
where the linear attenuation coefficients μL, μT, and μB are of lung, tumor, and “body” respectively (“body” representing all other tissue through which the beam passes), and xT and xB represent the thickness of the tumor and the thickness of the body, respectively. To determine how the fluence incident at the detector is related to the fluence from the source, the attenuation of the beam due to the patient is accounted for by
| (8) |
where No is the number of photons from the source within the solid angle that penetrates only the tumor (ϕo is equal to No/A), and the effects of scatter must be included by
| (9) |
The SNR in the previous equations was defined by the photons incident on the detector (SNRin), while the Rose Criterion specifies the minimum SNR (5) of the final image (SNRout). Those two SNRs are related by
| (10) |
where DQE is the detective quantum efficiency of the detector and subsequent electronics. The relationship between the area of the tumor at the detector (A) and the system and patient geometry (as in Fig. 1) is
| (11) |
where dT is the thickness of the tumor. Combining the preceding equations we obtain
| (12) |
which gives the fluence within the solid angle that penetrates only the tumor necessary to achieve the desired SNR, given the scatter-to-primary ratio, the area of the tumor at the detector, the DQE of the detector, and the attenuation coefficients of the tumor, lungs and body which the beam penetrates. The fluence (ϕo) in this solid angle is calculated at the plane of the detector with the assumption of no attenuation of the beam. It should be noted that this calculated fluence, ϕo [Eq. 12], has a different application depending on whether it is applied to SBDX or conventional fluoroscopy because ϕo assumes one beam which only penetrates the tumor. With conventional fluoroscopy, the fluence in that solid angle is extrapolated over the whole beam. With the SBDX system, there are multiple beamlets penetrating the tumor in any TDD, so this calculated fluence, ϕo, is distributed over those beamlets (accounting for partial coverage of some beamlets). The resulting fluence per beamlet is then applied to all 100 × 100 beamlets including the beamlets which do not penetrate the tumor. This calculated fluence at the detector is related to a given kV and mAs for each system based on measurements of beam spectra per mAs (discussed in Sec. 2C). This allows for the different geometries to be compared based upon the same tumor SNR, or in other words, for approximately the same level of tumor visualization in 2D projection images.
Monte Carlo model
The unique geometry of the SBDX system poses a challenge for modeling. The system has a large area scanned x-ray source coupled with a very fast cadmium telluride detector. The source is a transmission target, above which is a collimator with 100 × 100 holes spread equally over a 23 × 23 cm area, which form the beamlets. The collimator restricts the primary beamlets such that each beamlet just covers the area of the small 10.7 × 5.5 cm detector. Thus each beamlet penetrates the patient at different angles in both roll and yaw, or in other words different angles along both the axial plane and sagittal plane.
PCXMC is a Monte Carlo simulation software package developed at STUK (Radiation and Safety Authority of Finland) by Tapiovaara and Sliskonen.20 PCXMC calculates the dose for 29 different organs/tissues as well as calculating the effective dose using both the ICRP 60 and ICRP 103 protocols. The numerical phantom represents an adjustable hermaphrodite, which can be adjusted for height, weight, and age (from pediatric to adult) according to Cristy and EcKERMAn.21 Acquisition geometry can be changed, and PCXMC has built in software to simulate the x-ray tube given certain physical parameters such as the anode angle, shielding materials, and filter thicknesses. It is also possible to input a user-specified x-ray spectrum.
For our calculations, a new version of PCXMC was developed which permits each beamlet to be described using roll and yaw. Adjustments were also made to facilitate importing x-ray spectra to streamline calculations since the SBDX system has hundreds of focal spot locations per image, and the spectrum from the transmission target x-ray tube is not accurately modeled by the PCXMC program. Our simulations were performed using the standard adult height of 178.6 cm, with a weight of 73.2 kg.
The dose from the SBDX system was compared to the dose from a standard clinical C-arm fluoroscopy unit (GE OEC-9800). Measurements on the C-arm fluoroscopy system were made using a Radcal 9010 Dosimeter and a Radcal 60cc 10X5−60 ion chamber at 3 different kVp and mA settings (78 kVp and 2.9 mAs, 48 kVp and 0.5 mAs, 120 kVp and 3.0 mAs) at 20, 48, and 70 cm from the source. The average settings for a patient on the GE OEC-9800 for TBNbx are 78 kVp and 2.9 mAs. The dosimeter gave readings in units of rad. The duration of each reading was also recorded. The dosimeter readings were first converted to mGy and then using the time duration of each measurement and the set mA of the system for the readings, the readings were converted to units of . The dose-area-product was calculated at all three physical locations and was used to calculate the KERMA at the detector.
Using these KERMA per mAs values from the system, we can calculate the needed dose from the system to achieve a given tumor SNR. For c-arm fluoroscopy we see that
| (13) |
where DSNR is the dose to the patient for a given SNR, DMC is the dose from the Monte Carlo simulation normalized to 1 mAs, DSys is from the system dosimeter readings in , ϕnorm is the energy spectrum of the beam normalized such that ∫EϕnormdE = 1, is the ratio of the area of the beam over the area of the solid angle that penetrates the tumor in any given slice, and ϕo is the calculated fluence from Eq. 12 necessary for the desired tumor SNR. The factor is necessary as ϕo [Eqs. 12, 13] assumes that the whole beam penetrates the tumor, but with fluoroscopy much of the beam does not.
Raw spectra of the SBDX source were provided by Triple-Ring for a variety of kVps in units of . Inherent filtration of the beam through the subsequent layers of beryllium, water, and aluminum in the system was then included. The effective energy of the spectrum ranged from 40.1 keV for a 70 kVp scan to 52.5 keV for a 120 kVp scan. By integrating the product of the number of photons and their energy for all keV in the beam and converting to Joules (giving ), multiplying by the known area of exposure for each beamlet, and multiplying the attenuation coefficient for air and air density, we found the air KERMA per mAs (). With these units we can compare the SBDX KERMA per mAs against the C-arm fluoroscopy values.
Using these KERMA per mAs values from this system, we can calculate the needed dose to achieve a given tumor SNR. For the SBDX we see that
| (14) |
where Nall is the total number of beamlets (10 000), Nt is the number of beamlets penetrating the tumor (varies with TDD), and the other equation components are the same as in Eq. 13.
The simulations were run at 78 kVp for both systems. The DQE for each system was obtained from the literature, the SBDX having a DQE of 0.9 and the C-arm having a DQE of 0.6.22, 23, 24
Simulations were performed at patient locations with the tumor at 50, 55, and 60 cm from the source with the FOV centered on the left lung and again on the right lung. Because the left lung had higher effective dose (largely because of the inclusion of the heart and esophagus in the FOV) the remainder of the simulations were performed with the FOV centered on the left lung (about 8 cm left of the median plane and about 15 cm inferior from the shoulder). Expected doses from the SBDX system were evaluated for SDDs of 90, 100, 110, and 150 cm, and for the patient located with the tumor 20, 35, 40, 50, 55, 60, 70, 75, and 90 cm from the source (Fig. 1). Additionally, simulations were run at the medial and distal peripheries of the lungs to evaluate changes in dose distribution (data not shown).
RESULTS AND DISCUSSION
ENB compatibility
The ENB system accuracy was adversely affected near both the source and detector (Fig. 4). There was evidence that the EM interference from the detector was significantly influenced by the metal bracing of the C-arm, which holds and supports the detector. The detector mounting material and the design of the detector mount can be changed to reduce interference with the EM system, while the x-ray source includes electromagnetic steering and shielding which cannot be modified. Because of this 50 cm EM setback from the source and the 10 cm setback from the detector due to the detector bracing, simulations were performed for realizable SDDs of 90, 100, and 110 cm, which would provide adequate space for patients while minimizing the SDD. If the decreased SDD causes significant EM interference, a solution is to simply move the SBDX system out of the way while operating the ENB system. Because the ENB system uses the working channel of the bronchoscope, the tumor cannot be sampled while the ENB is used. Thus moving the SBDX system away during ENB use and back into place as the ENB probe is removed from the working channel and the needle is inserted would not cause any increase in the duration of the procedure.
Figure 4.
RMS error and TME were measured on the ENB system when integrated with the SBDX system with the original 150 cm SDD. The distance from the source was measured to the center of the calibration fixture. The dotted lines indicate the reference value, when the accuracy test was performed far away from the SBDX system.
Tomographic angle
Figure 5 outlines the effect of SDD on tomographic angle based on geometric calculations. As SDD is decreased, the highest possible tomographic angle increases. Because the tomographic angle is a purely geometric factor, it is possible to calculate where the maximum angle will be given the effective width of the source and detector; the maximum tomographic angle occurs at a distance of 69.7% of the SDD from the source in our setup. Given the current 50 cm setback from the detector (due to EM interference with the ENB guidance system) no change in SDD will yield a greater tomographic angle within our operating range unless we decrease the required gap between the patient and the detector (see Fig. 5). To change the SDD while maintaining compatibility with the ENB system, the bracing holding the detector will need to be changed as described above. It should be noted that this geometry presumes that the tumor is in the center of the FOV because the tomographic angle and the total fluence drops in every direction from the optimal point (see Pineda et al.14 for more on the tomographic angle in 3D space). As a result this ideal geometry is limited to small spheroid objects and not objects like vessels.
Figure 5.
Tomographic angle as a function of distance from the detector for various SDDs as measured between the midline of the detector and the midline of the source collimator.
Patient dose
Placing the patient closer to the detector increases the scatter and also increases the patient dose. Figure 6 shows the dose to the patient at a fixed 300 mAs as a function of source-to-tumor distance as compared to that of the standard fluoroscopy system running at the same mAs. The dose of the two systems were normalized using the methods discussed in Sec. 2C. Dose using the inverse geometry system decreases closer to the source, while the opposite is true for the traditional fluoroscopy system. Again, the impact on image quality as the patient is moved closer to and farther from the source is not considered in Fig. 6.
Figure 6.
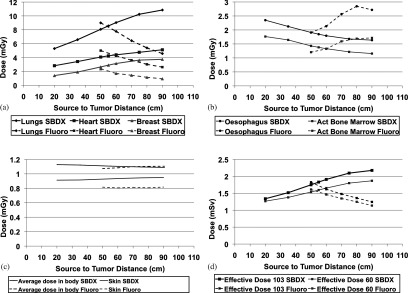
Dose as a function of source-to-tumor distance. Each beamlet was run for 0.03 mAs (there are 10 000 beamlets) and the fluoroscopy unit was run for 300 mAs. These simulations used an SDD of 110 cm. (a) This shows three organs which had the highest doses and an increase in dose as the patient was moved farther from the source. (b) The dose to the esophagus and active bone marrow decrease as the patient is moved farther from the source. (c) The average dose in the total body (in gray, not sieverts) and the skin are shown. (d) These are the effective doses in sieverts. One can see that the effective doses are dominated by the lungs because of the “geometry” of the organs themselves and the trajectory of the beamlets.
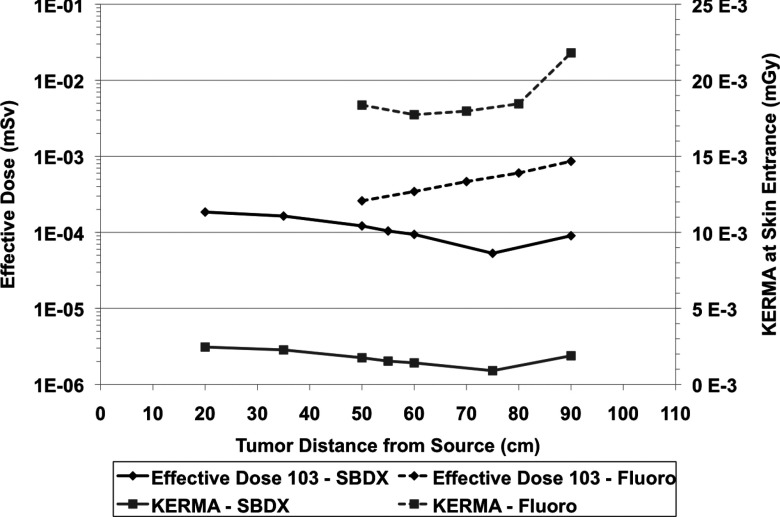
There is a strong geometrical effect from the organ distribution in the patient. Figure 6 shows that the average dose to the body stays constant regardless of patient location, however the effective dose changes. When calculating effective dose, different organs have different weight, and the irradiated volume of the various organs changes with patient location. Figure 6a shows the three organs with the highest dose. The heart receives high dose as this is focused on imaging a nodule in the left lung. As the patient moves closer to the detector, the beams converge and these organs near the center of the field of view receive higher dose. In fluoroscopy however, we see a decrease in the dose to those organs as the fluence of the beam decreases by the inverse square law. In Fig. 6b, with the SBDX system, as the patient moves closer to the detector, the beams converge and the esophagus is no longer in the path of the beamlets. With fluoroscopy, as we move toward the detector, we first see an increase in dose as the esophagus moves into the beam's field of view. Then as the patient moves even closer to the detector, the volume irradiated increases at a much slower rate and the drop in fluence becomes more significant, thus the esophagus dose decreases. Figure 6c shows that the average dose to the body (in mGy) and the total skin dose (to all the skin in the body) stay relatively flat regardless of patient position and Fig. 6d shows the effective dose (in mSv) which are heavily influenced by the dose to the lungs. Peak skin dose can be a concern with fluoroscopy in interventional radiology procedures. The image guidance for this procedure would not reach those dose levels, but it is worth evaluating. Studies have shown that while “dose area product” is a reasonable way to estimate peak skin dose, reference air KERMA is more accurate.25 The air KERMA at the skin entrance is shown in Fig. 7.
Figure 7.
The effective dose to the patient in mSv to achieve a tumor SNR of 5. Calculations shown here were made using the ICRP 103 protocol. Air KERMA at the skin entrance is also shown for fluoroscopy and SBDX. These simulations used a SDD of 110 cm.
To standardize our comparison of different geometries, a constant SNR of the tumor was used based on the Rose Criterion. The beam fluence necessary to achieve this SNR was calculated, taking into account the magnification [Eqs. 4, 5, 11, 12]; attenuation [Eqs. 7, 8, 12]; scatter [Eqs. 6, 9, 12, values derived from Persliden and Carlsson19]; and efficiency of photon detection at the detector [Eqs. 10, 12, value obtained from Speidel26]. The SBDX system has an advantage over the standard fluoroscopy system because multiple beamlets image the tumor, and the fluence is distributed over those beamlets, thus lowering the needed fluence of any one beamlet. Because of this, there is an interesting reversal of the trend in Fig. 6d. In Fig. 6d using the same fluence regardless of patient location generates lower patient dose when the patient is close to the source. In Fig. 7, the fluence is adjusted to maintain constant tumor SNR at the detector regardless of patient location. For the current system, the same mAs is used for all beamlets. In the SBDX system the primary photons imaging the tumor come in nearly equal parts from the beamlets which penetrate the tumor so the fluence for each individual beamlet is lower than that needed for the total tumor photon statistics. The SBDX system has decreasing patient dose requirement as the patient is moved closer to the detector. This is because not all beamlets penetrate the tumor (Fig. 8). When the patient is close to the source and the image FOV is large, many beamlets contribute dose to organs without contributing any primary photons to imaging of the tumor. A minimum dose is reached at the point closest to the source in which all 10 000 beamlets are penetrating the tumor. Note that even though there are many, or in some cases most, of the beamlets which are only adding dose with no direct tumor image information, the effective dose to the patient is significantly lower than the same tumor SNR using fluoroscopy (Fig. 7). The dose to various organs follow the same trend as the effective dose between Figs. 6d, 7. For example, the skin dose when the tumor is 20 cm from the source is 0.126 μGy, at 75 cm is 0.0239 μGy, and at 90 cm is 0.0394 μGy.
Figure 8.

Air KERMA and number of beamlets with changing patient location while maintaining tumor SNR on the SBDX. (a) The air KERMA at the detector (if the patient were absent) necessary for maintaining SNR at multiple patient locations while collimating down the beams to various distances around the tumor. The beam collimation measurements represent a square (with a length of our measurement) in the plane of the tumor outside of which beamlets are removed. (b) the number of beamlets which contribute to tumor signal and the number of beamlets used when different collimator sizes are used. The dashed lines represent the number of beamlets necessary for the trend to continue if our collimator had more than 10 000 beamlets. These simulations used a SDD of 110 cm.
To decrease the dose even further for patient positions between the source and the location of minimal dose in Fig. 7, the beamlets not penetrating the tumor (and therefore adding peripheral dose) could be turned off or collimated. The SBDX system is capable of operating in a 71 × 71 scan mode in addition to the 100 × 100 full size scan, which could remove many unnecessary beamlets. Collimation could also be used to block unneeded beamlets. The collimation in Fig. 8 is achieved by only using a subset of the beamlets such that in the plane of the tumor there is only fluence through a square with a length of 2.5, 5, 7.5, and 10 cm. For this simulation the collimation was achieved by turning off, or removing beamlets at the source. For some TDDs no beamlets need to be removed to confine the fluence through the square in the plane of the tumor. As shown in Fig. 8a, when collimation is added to the simulation the patient dose drops for those patient locations close to the source. With tight collimation around the tumor we see the trend that we would intuitively expect to see, that when the tumor is closer to the detector there is an increase in scatter and a higher fluence is needed to maintain SNR and there is therefore an increase in dose. In Fig. 8b, the beams through the tumor (the black line) shows why for SBDX, very small TDDs increase patient dose. The trend as we move to larger source to tumor distances is that more beamlets contribute to tumor signal and thus fewer are giving peripheral dose. Additionally, the needed fluence for our chosen SNR is divided over a larger number of beamlets. For this trend to continue close to the detector, the source array would need to be much larger to facilitate averaging the dose over more beamlets.
Note, however, that in general this approach would not be needed since the location that provides the maximum tomographic angle is also the location with the maximum number of beamlets subtending the tumor. In fact, collimating when the patient is in this location would not only be unnecessary, but would have the negative effect of decreasing the tomographic angle. Even if the patient was far from the ideal location of maximum tomographic angle and could benefit from collimation, all patient locations have very low dose, approximately 2–10 times lower than fluoroscopy for the same tumor SNR. This applies to individual organ doses in addition to the effective dose. For example, the dose to the lungs at the minimum point in Figure 7 is 0.26 μGy with the SBDX, while it is 2.2 μGy with fluoroscopy. At 50 cm from the source the dose to lungs is 0.56 μGy with the SBDX, while it is 1.3 μGy with fluoroscopy.
System geometry
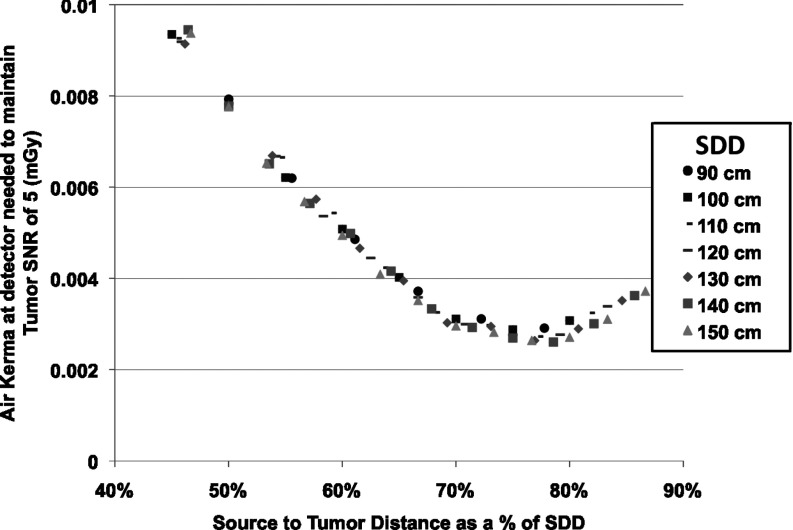
In Fig. 9, the effect on dose of changing SDD is related to the patient location within a set SDD. When looking at the air KERMA necessary at the detector to achieve the same tumor SNR, the dominating factor is the location of the tumor relative to both the source and detector. In other words, if the necessary air KERMA at the detector for constant tumor SNR is plotted across configurations by STD/SDD we see the points fall almost exactly on one curve. This indicates that the convergence of the beamlets, which again means that fewer beamlets contribute peripheral dose, is a vastly more dominating factor than the effect from any individual beamlet or the effect of increased scatter when the patient is close to the detector. The closest the tumor was to the detector in simulations was 20 cm and the was 0.49 (the highest of any simulation). Most simulations had a less than 0.1. The effect of scatter was negligible compared to the geometry and convergence of beamlets.
Figure 9.
The air KERMA needed at the detector to achieve a tumor SNR of 5 as a function of the ratio of source-to-tumor distance over the SDD for multiple SDDs on the SBDX system.
CONCLUSIONS
The motivation in working with the SBDX system is to take advantage of its ability to rapidly acquire images from different angles and thus allow for real-time tomosynthesis imaging. This would facilitate real-time 3D image guidance for lung tumor biopsies and decrease the high false negative rate of the procedure. To achieve this, it is important to increase the tomographic angle, which will improve the inplane detectability and reduce slice thickness of the tomographic image and to consider how patient dose and image quality are affected by varying patient location and SDD. We calculated the maximum tomographic angle at a variety of patient locations and SDDs. Because of the set size of the source array and the detector, there is a set location (∼70% of the SDD) at which the tomographic angle is a maximum. We showed that the current setup of the SBDX system will cause EM interference of the ENB system within 50 cm of the source and within 50 cm of the detector. It was found that the current bracing of the detector is the major factor of the interference. The bracing for the detector will need to be replaced with bracing of a different material.
To identify the optimal SDD and patient location, an equation was derived to normalize the system fluence for constant SNR. The equation was then used to determine the dose to patient organs and the patient effective dose. The patient location which has the lowest dose for a given SNR is very close to the location of maximum tomographic angle for any choice of SDD. This is true for imaging a tumor located anywhere in the lungs; we see the same trends, just at lower doses as most of the other locations in the lungs have fewer beamlets penetrating radiosensitive organs. The SDD for an optimal system then is to have as small a SDD as is possible given physical constraints. Changing the 50 cm setback from the source (due to EM interference with the ENB system) would require a major redesign of the SBDX system itself and is financially prohibitive. Given the range of sizes of patients to be accommodated with the system, 35 cm of space would accommodate virtually all patients. If room is also left for the bracing (as the detector itself will be within the bracing), then an SDD of about 100 cm is optimal. However, this is subject to whatever the new EM setback will be with the new detector. This interference may dictate a larger SDD.
Currently much of the reconstruction occurs via hardware rather than software. Thus future work will seek to adjust the hardware in order to implement our current reconstruction algorithm, which is capable of real-time reconstruction.
Because the derived equation for beam fluence at a given geometry assumed a simple lesion in uniform background, the impact of the complex mix of tissues, particularly in the lungs (with thick bronchial branches, blood vessels, etc.) is not considered. As a result, anatomical noise is not included in the equation for SNR. The approaches developed in this study can be used to evaluate patient dose from an inverse geometry system relative to traditional systems generally. In particular it dictates the optimal system configurations for tomographic imaging with the SBDX system. Future work will test these dose models and image quality predictions on the modified SBDX system to evaluate both the quality of the models and the image quality.
ACKNOWLEDGMENTS
This work is supported by Grant NIH R21 HL098683. The SBDX system was made available by NovaRay Inc. The authors would like to thank Meng Wu and Dr. Jarrett Rosenberg for their helpful discussion and assistance.
References
- Henschke C. I., McCauley D. I., Yankelevitz D. F., Naidich D. P., McGuinness G., Miettinen O. S., Libby D. M., Pasmantier M. W., Koizumi J., Altorki N. K., and Smith J. P., “Early lung cancer action project: Overall design and findings from baseline screening,” Lancet 354, 99–105 (1999). 10.1016/S0140-6736(99)06093-6 [DOI] [PubMed] [Google Scholar]
- Lechtzin N., Rubin H. R., White J., Jenckes P. M., and Diette G. B., “Patient satisfaction with bronchoscopy,” Am. J. Respir Crit. Care Med. 166, 1326–1331 (2002). 10.1164/rccm.200203-231OC [DOI] [PubMed] [Google Scholar]
- Wiener R. S., Schwartz L. M., Woloshin S., and Welch H. G., “Population-based risk of complications following transthoracic needle lung biopsy of a pulmonary nodule,” Ann. Intern. Med. 155, 137–144 (2011). 10.7326/0003-4819-155-3-201108020-00003 [DOI] [PMC free article] [PubMed] [Google Scholar]
- Hiraki T., Mimura H., Gobara H., Shibamoto K., Inoue D., Matsui Y., and Kanazawa S., “Incidence of and risk factors for pneumothorax and chest tube placement after ct fluoroscopy–guided percutaneous lung biopsy: Retrospective analysis of the procedures conducted over a 9-year period,” Am. J. Roentgenol. 194, 809–814 (2010). 10.2214/AJR.09.3224 [DOI] [PubMed] [Google Scholar]
- Triller N., Dimitrijevic J., and Rozman A., “A comparative study on endobrochial ultrasound-guided and fluoroscopic-guided transbronchial lung biopsy of peripheral pulmonary lesions,” Respir. Med. 105, S74–S77 (2011). 10.1016/S0954-6111(11)70015-4 [DOI] [PubMed] [Google Scholar]
- Matsui Y., Hiraki T., Mimura H., Gobara H., Inoue D., Iishi T., Toyooka S., and Kanazawa S., “Role of computed tomography fluoroscopy–guided cutting needle biopsy of lung lesions after transbronchial examination resulting in negative diagnosis,” Clin. Lung Cancer 12, 51–55 (2011). 10.3816/CLC.2011.n.007 [DOI] [PubMed] [Google Scholar]
- Gupta S., Krishnamurthy S., Broemeling L. D., F. A.MorelloJr., Wallace M. J., Ahrar K., Madoff D. C., Murthy R., and Hicks M. E., “Small ( ⩽ 2-cm) subpleural pulmonary lesions: Short-versus-long-needle-path CT-guided biopsy-comparison of diagnostic yields and complications,” Radiology 234, 631–637 (2005). 10.1148/radiol.2342031423 [DOI] [PubMed] [Google Scholar]
- Wang K. P., “Transbronchial needle aspiration and percutaneous needle aspiration for staging and diagnosis of lung cancer,” Clin. Chest Med. 16, 535–552 (1995). [PubMed] [Google Scholar]
- Harrow E. M., Abi-Saleh W., Blum J., Harkin T., Gasparini S., Addrizzo-Harris D. J., Arroliga A. C., Wight G., and Mehta A. C., “The utility of transbronchial needle aspiration in the staging of bronchogenic carcinoma,” Am. J. Respir. Crit. Care Med. 161, 601–607 (2000). 10.1164/ajrccm.161.2.9902040 [DOI] [PubMed] [Google Scholar]
- Rong F. and Cui B., “CT scan directed transbronchial needle aspiration biopsy for mediastinal nodes,” Chest 114, 36–39 (1998). 10.1378/chest.114.1.36 [DOI] [PubMed] [Google Scholar]
- Dale C. R., Madtes D. K., Fan V. S., Gorden J. A., and Veenstra D. L., “Navigational bronchoscopy with biopsy versus computed tomographyguided biopsy for the diagnosis of a solitary pulmonary nodule: A cost-consequences analysis,” J. Bronchology. Intervent. Pulmonol 19, 294–303 (2012). 10.1097/LBR.0b013e318272157d [DOI] [PMC free article] [PubMed] [Google Scholar]
- Brownback K. R., Quijano F., Latham H. E., and Simpson S. Q., “Electromagnetic navigational bronchoscopy in the diagnosis of lung lesions,” J. Bronchol. Intervent. Pulmonol. 19, 91–97 (2012). 10.1097/LBR.0b013e31824dd9a1 [DOI] [PubMed] [Google Scholar]
- Lamprecht B., Porsch P., Wegleitner B., Strasser G., Kaiser B., and Studnicka M., “Electromagnetic navigation bronchoscopy (enb): Increasing diagnostic yield,” Respir. Med. 106, 710–715 (2012). 10.1016/j.rmed.2012.02.002 [DOI] [PubMed] [Google Scholar]
- Pineda A. R., Yoon S., Paik D. S., and Fahrig R., “Optimization of a tomosynthesis system for the detection of lung nodules,” Med. Phys. 33, 1372–1379 (2006). 10.1118/1.2190329 [DOI] [PubMed] [Google Scholar]
- Curry T. S., Dowdey J. E., Murry R. C., and Christensen E. E., Christensen's Physics of Diagnostic Radiology, 4th ed. (Lea & Febiger, Philadelphia, PA, 1990). [Google Scholar]
- Sabol J. M., “A Monte Carlo estimation of effective dose in chest tomosynthesis,” Med. Phys. 36, 5480–5487 (2009). 10.1118/1.3250907 [DOI] [PubMed] [Google Scholar]
- Zachrisson S., Vikgren J., Svalkvist A., Johnsson A. A., Boijsen M., Flinck A., Mansson L. G., Kheddache S., and Bath M., “Effect of clinical experience of chest tomosynthesis on detection of pulmonary nodules,” Acta Radiol. 50, 884–891 (2009). 10.1080/02841850903085584 [DOI] [PubMed] [Google Scholar]
- Rose A., “Quantum effects in human vision,” Adv. Biol. Med. Phys. 5, 211–242 (1957). [DOI] [PubMed] [Google Scholar]
- Persliden J. and Carlsson G. A., “Scatter rejection by air gaps in diagnostic radiology: Calculations using a Monte Carlo collision density method and consideration of molecular interference in coherent scattering,” Phys. Med. Biol. 42, 155–175 (1997). 10.1088/0031-9155/42/1/011 [DOI] [PubMed] [Google Scholar]
- Tapiovaara M. and Siiskonen T., “Pcxmc,” Technical Report No. 2.0 Rotation, STUK, 2011.
- Cristy K. and Eckerman M., “Specific absorbed fraction of energy at various ages from internal photon sources” Technical Report No. ORNL/TM-8381/V1, Oak Ridge National Laboratory, 1987.
- Gagne R. M., West C. N., Wagner R. F., and Quinn P., “Laboratory measurements of sensitometry, MTF, veiling glare, wiener spectrum and DQE for image intensifier tubes,” Proc. SPIE 1896, 248–258 (1993). 10.1117/12.154596 [DOI] [Google Scholar]
- Solomon E. G., Wilfley B. P., Van Lysel M. S., Joseph A. W., and Heanue J. A., “Scanning-beam digital x-ray (SBDX) system for cardiac angiography,” Proc. SPIE 3659, 246–257 (1999). 10.1117/12.349499 [DOI] [Google Scholar]
- Speidel M. A., Wilfley B. P., Star-Lack J. M., Heanue J. A., and Van Lysel M. S., “Scanning-beam digital x-ray (SBDX) technology for interventional and diagnostic cardiac angiography,” Med. Phys. 33, 2714–2727 (2006). 10.1118/1.2208736 [DOI] [PubMed] [Google Scholar]
- Kwon D., Little M. P., and Miller D. L., “Reference air kerma and kerma-area product as estimators of peak skin dose for fluoroscopically guided interventions,” Med. Phys. 38, 4196–4204 (2011). 10.1118/1.3590358 [DOI] [PMC free article] [PubMed] [Google Scholar]
- Speidel M. A., Lowell A. P., Heanue J. A., and Van Lysel M. S., “Frame-by-frame 3d catheter tracking methods for an inverse geometry cardiac interventional system,” Proc. SPIE 6913, 69131I (2008). 10.1117/12.772745 [DOI] [Google Scholar]


