
Figure 6.
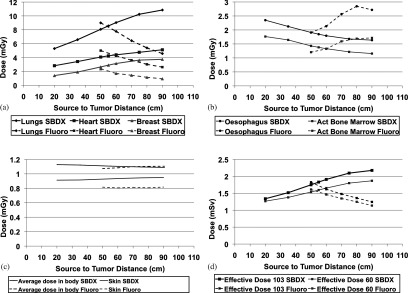
Dose as a function of source-to-tumor distance. Each beamlet was run for 0.03 mAs (there are 10 000 beamlets) and the fluoroscopy unit was run for 300 mAs. These simulations used an SDD of 110 cm. (a) This shows three organs which had the highest doses and an increase in dose as the patient was moved farther from the source. (b) The dose to the esophagus and active bone marrow decrease as the patient is moved farther from the source. (c) The average dose in the total body (in gray, not sieverts) and the skin are shown. (d) These are the effective doses in sieverts. One can see that the effective doses are dominated by the lungs because of the “geometry” of the organs themselves and the trajectory of the beamlets.