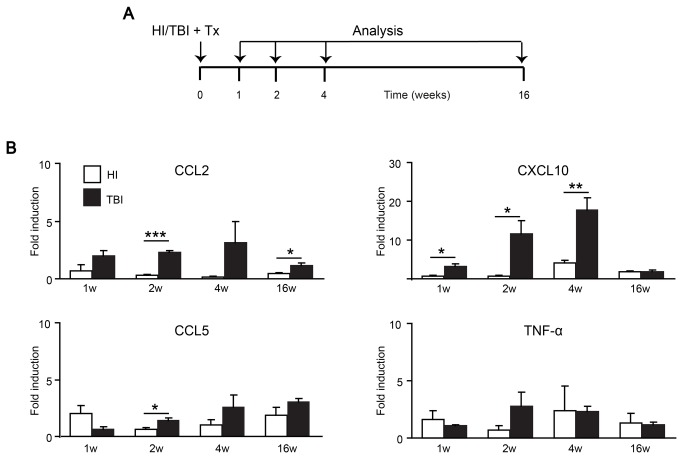
Figure 1. Gene expression profiles of cytokines and chemokines in the brain after HI and TBI.
A) Overview of the experimental protocol. HI, TBI and Tx denote focal head irradiation, total body irradiation and bone marrow transplantation, respectively. B) Quantitative real-time PCR of CCL2, CXCL10, CCL5 and TNF-α mRNA expression in brains of HI (grey columns) and TBI (white columns) animals at 1, 2, 4 and 16 weeks after irradiation and BMT. The mRNA expression levels were normalized to GAPDH mRNA and compared to naïve mice (fold induction). Reduced cytokine/chemokine mRNA levels were observed in HI brains compared to the TBI paradigm. Data are means + SEM from 3-5 animals per group. Statistical significance is indicated by asterisks (*p<0.05; **p<0.01; ***p<0.001).

