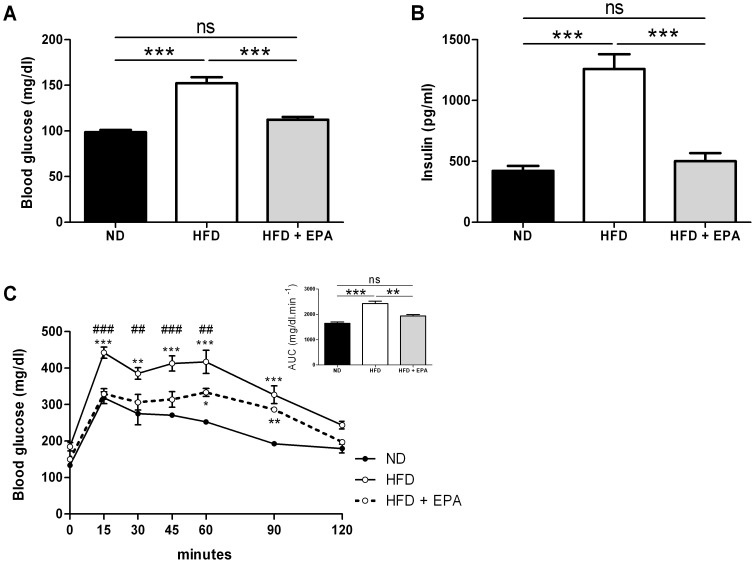
Figure 3. Protective effect of EPA supplementation on the HFD-induced impaired glucose metabolism.
(A) Glycemia and (B) insulinemia in 6 h-fasted mice fed a ND (n = 12), a HFD (n = 14) or a HFD+EPA (n = 14) after 10 weeks. Results represent mean ±SEM. ***p<0.001, (C) OGTT curves and area under the curve (AUC) of glycemia monitored during OGTT performed on 6 h fasted (during light period) mice after 9 weeks of diet in ND (n = 4), HFD (n = 6) and HFD+EPA (n = 6) mice. Results represent mean ±SEM. *p<0.05, **p<0.01, ***p<0.001 vs ND; and ## p<0.01, ### p<0.001 vs HFD.

