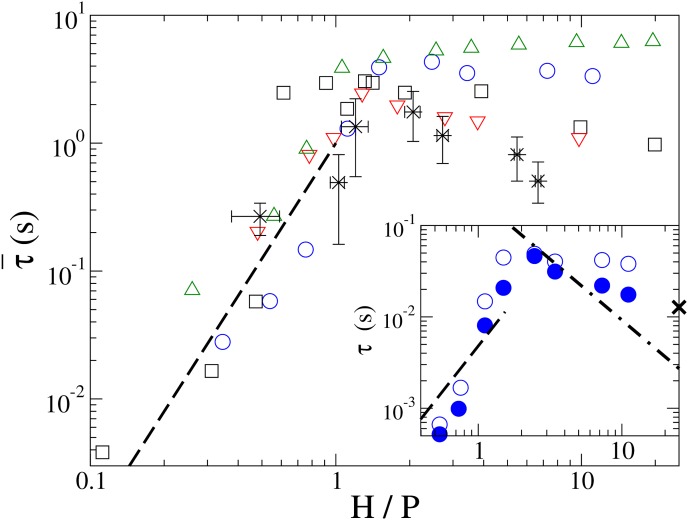
Figure 4.
The scaled chain relaxation time for N = 1000, P/σm = 25 (circles), N = 400, P/σm = 10 (squares), and N = 800, P/σm = 5 (triangles). Data from Ref. 5 are shown as stars with error bars. Chain relaxation time is rescaled according to its dependence on the chain contour length, , Lλ = λ-DNA contour length of 16 μm. The inset shows the relaxation time with (filled circle) and without HI (empty circle) for N = 160, P/σm = 4. X marks the estimated τbulk for L = 2 μm. The dashed and dotted-dashed lines show H3/ln(H/σm) and (H/P)2 dependences, respectively. The error estimates are comparable to the symbol size.

