
Figure 2. Proliferative capacity of ALL-MSCs as compared with HD-MSCs.
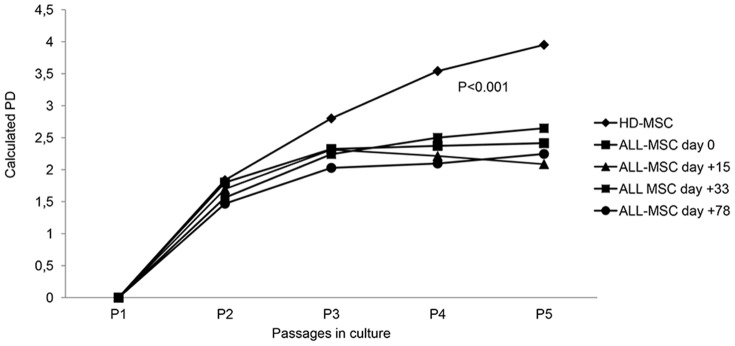
Calculated cumulative population doublings (PDs) from P1 to P5 of MSCs isolated from HDs and from ALL patients at diagnosis and at following time-points of treatment, namely day+15, +33 and +78. The data represent the mean of 10 HD-MSCs and 10 ALL-MSCs. P values less than 0.05 were considered to be statistically significant.