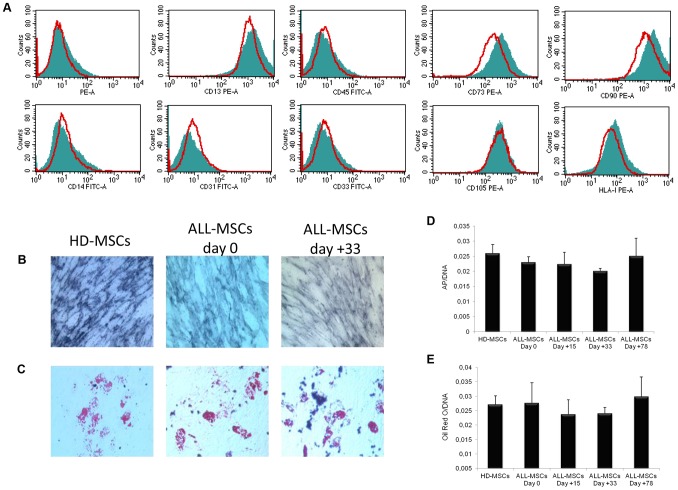
Figure 4. A: Phenotypic and differentiation characterization of ALL-MSCs.
Immunophenotype of culture-expanded HD-MSCs and ALL-MSCs at diagnosis from a representative sample. In red HD-MSCs and in green ALL-MSCs. Histograms of surface marker expression of HD-MSCs and ALL-MSCs are similar: both types of MSCs are positive for CD13, CD73, CD90, CD105 and HLA-I surface antigens and negative for CD14, CD31, CD33 and CD45 molecules. Immunophenotype of ALL-MSCs at subsequent time-points of the disease and treatment was superimposable. B and C: Osteogenic and adipogenic differentiation capacity of MSCs isolated from one representative HD and one ALL patient at diagnosis (d+0) and at d+33. In B, the differentiation into osteoblasts is demonstrated by the histological detection of alkaline phosphatase (AP) activity (purple reaction); magnification ×20. In C, the differentiation into adipocytes is revealed by the formation of lipid droplets stained with Oil Red O; magnification ×20. D and E: Quantification of the osteogenic and adipogenic differentiation capacity of MSCs isolated from one representative HD and one ALL patient at diagnosis (d+0) and subsequent time-points (d+15, +33 and +78). In D the amount of AP is related to the amount of DNA extracted from the same wells and is expressed in mOD/min/mg; in E the amount of Oil Red O is related to the DNA content of the same wells and is expressed as mg/mg. Each bar represents the mean +/−SD of the results from three different experiments, each performed in triplicate.

