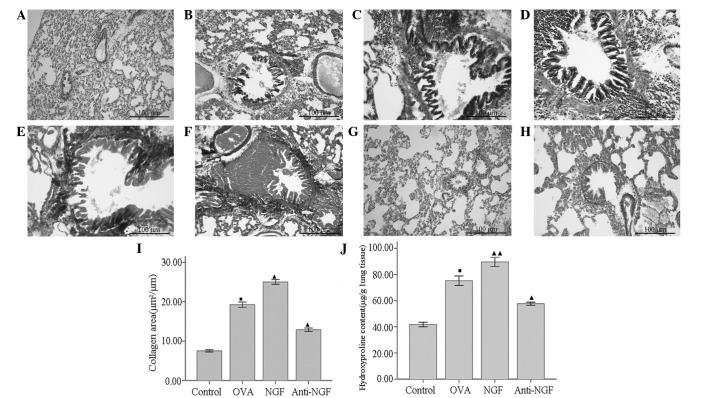
Figure 3.
Histological analysis of lung sections stained with (A–D) hematoxylin and eosin and (E–H) Masson’s trichrome 24 h following the final antigen challenge in rats (magnification, ×100). (A and G) PBS-treated, (B and H) anti-NGF-treated, (C and E) OVA-treated and (D and F) NGF-treated rats. ▪P<0.01 compared with that of the control group, ▴P<0.01 and ▴▴P<0.05 compared with that of the OVA group. PBS, phosphate-buffered saline; NGF, nerve growth factor; OVA, ovalbumin.

