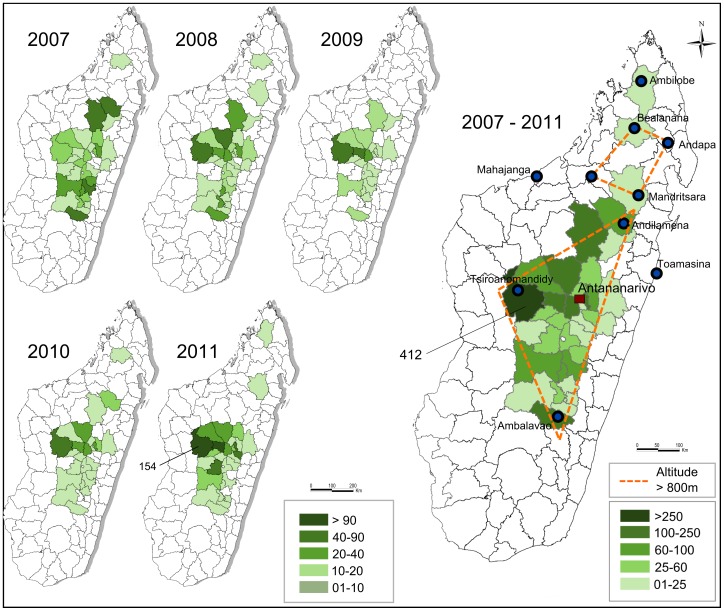
Figure 1. Madagascar plague mapping from 2007 to 2011.
Dashed line: limits of the main plague foci (central and northern foci). Green area: districts that have notified plague cases. Most plague cases were reported from the district of Tsiroanomandidy during this period. (Sources: OCHA, Institut Pasteur de Madagascar).

