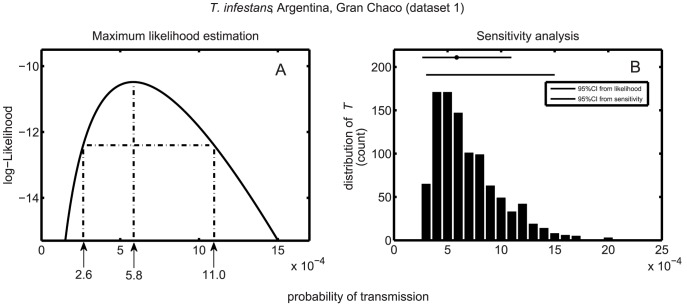
Figure 1. Maximum likelihood estimate of the probability of transmission of T. cruzi.
(A) profile likelihood, maximum likelihood estimate (MLE) of the probability of transmission T, and its 95% maximum likelihood confidence interval (MLCI). (B) Distribution of the MLE of T obtained from the sensitivity analyses (1000 replications). Grey and black horizontal bars on the top of the figure represent the 95% MLCI (with the grey dot corresponding to the MLE) and the interval including 95% of the MLE estimates obtained from the sensitivity analysis.

