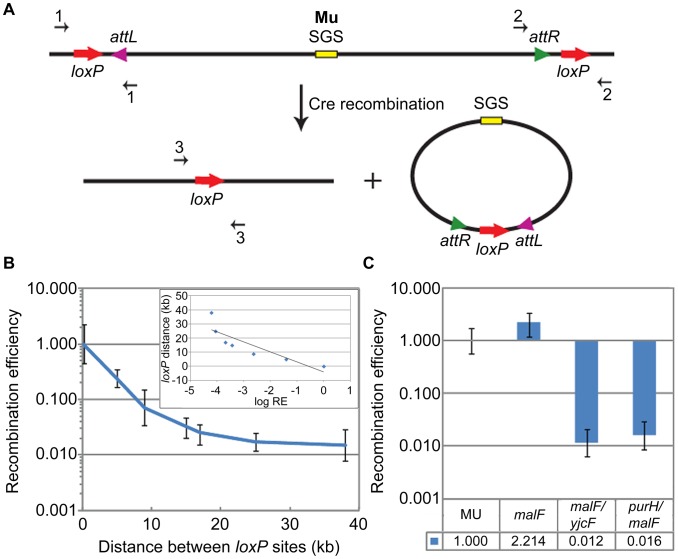
Figure 1. Cre recombination assay and loxP recombination as a function of distance.
(A) Schematic shows directly oriented loxP sites flanking prophage Mu attL and attR (L/R in text), and the deletion products of Cre recombination. The excised Mu prophage will be lost during cell growth. Amounts of chromosomal starting substrate and product were assessed by qPCR across the loxP sites in the substrate (primer pairs 1 or 2) and product (primer pair 3). (B) RE of loxP sites as a function of distance on the E. coli chromosome (see Figure S2A). RE (recombination efficiency) calculation is described under Materials and Methods. RE of the 190 bp loxP pair was arbitrarily set at 1 (this pair is designated malF in Figure 1C). Inset: log (base e) RE values were plotted against loxP distance, and fitted to a straight line equation  , where
  ; the slope (m) is ∼7 kbp. The plot is not quite linear because it includes two data points that fall within the plateau region of the graph (25 kbp and 37 kbp). A plot excluding the 37 kbp value is shown in Figure S2D. (C) RE of loxP sites placed ∼70 bp outside each end of the wild-type malF::Mu prophage in ZL524 (MU) is set at 1, and compared to the smallest (190 bp) (malF, ZL582) and largest (37 kbp) (malF/yjcF, ZL592 and purH/malF, ZL594) loxP pairs within the malF locus of the parent non-Mu strain (see Figure S2A). Bottom panel, precise fold differences in RE. Error bars are standard deviation from the mean.

