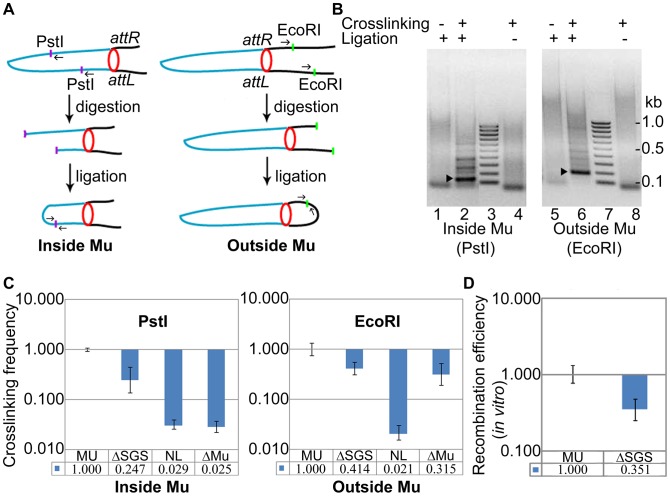
Figure 4. Interaction of prophage Mu ends probed by 3C methodology.
(A) Experimental design (see text and Materials and Methods). Blue line, Mu DNA; black line, E. coli DNA; purple and green dots, PstI and EcoRI sites, respectively; small arrows, primers used to amplify the DNA ligation product; red circle, paired L and R ends. (B) PCR products of ligation. Left: Primers were designed to produce a 155 bp fragment after PstI digestion-ligation (lane 2, arrowhead), and a 195 bp fragment after EcoRI digestion-ligation (lane 6, arrowhead); the fainter bands above the specific products in lanes 2 and 6 could not be re-amplified, hence are non-specific. The specific products were not observed in uncrosslinked (lanes 1, 5) and unligated (lanes 4, 8) samples. The band migrating at ∼100 bp in these lanes is non-specific. Lane 3, 7 DNA size marker ladder. (C) Quantitation of the ligation products. The qPCR signal obtained from wild-type MU ligation was set at 1. Crosslinking efficiency is defined as the ratio of qPCR signal from the ligation product in the ΔSGS strain compared to that in its wild-type parent. NL is the signal obtained from the non-ligated, crosslinked product in the wild-type reactions shown in lanes 4 and 8, and ΔMu is a similar control in a strain where Mu has been excised from ZL524 via recombination of the flanking loxP sites. The same set of primer pairs were used for all strains in either the PstI or the EcoRI panels. MU (ZL524), ΔSGS (ZL562), ΔMu (ZL580). (D) In vitro Cre-loxP recombination of the cross-linked DNA from the indicated strains before digestion with restriction enzymes.

