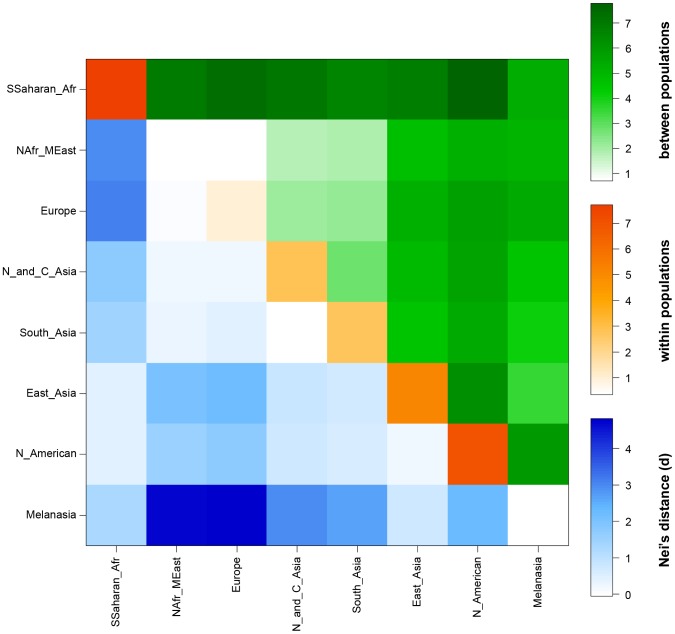
Figure 4. Heat map showing the intra- and inter-population variation measured by average pairwise sequence differences of the SLC24A5 gene.
The upper triangle of the matrix (green) shows average pairwise differences between populations (PiXY). The average number of pairwise differences (PiX) within each population is shown along the diagonal (orange). The lower triangle of the matrix (blue) shows differences between populations based on Nei's distance, i.e., corrected average pairwise differences (PiXY−(PiX+PiY)/2).

