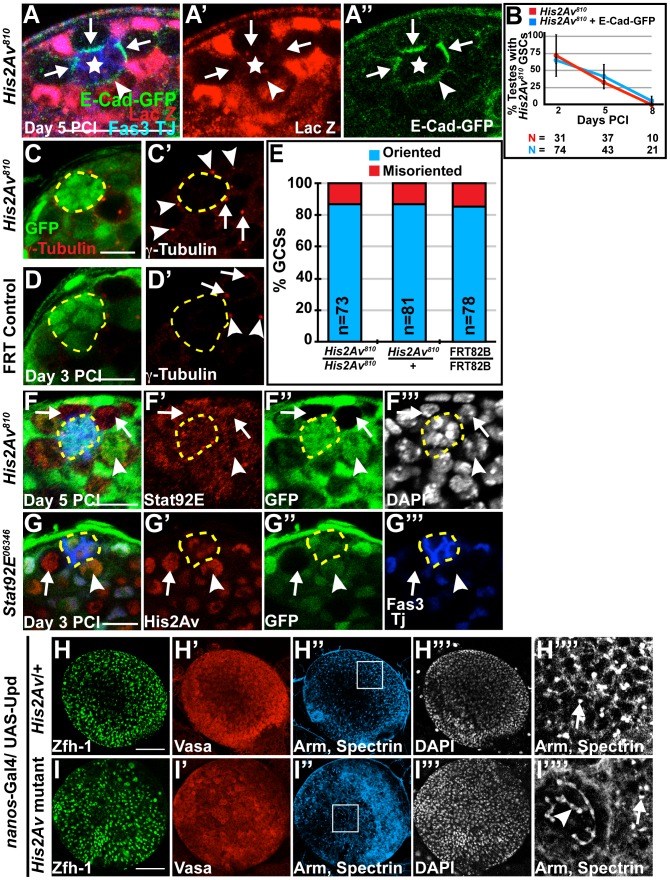
Figure 5. Loss of His2Av function did not cause defects in STAT dependent GSC characteristics.
(A–A″): His2Av810/+ testes at 5 days PCI and expressing E-Cadherin-GFP under the control of the nanos-Gal4 driver immunostained with anti-GFP (green), anti-β-galactosidase (LacZ, red) and anti-Fas3 and TJ (blue). His2Av810 mutant GSCs (arrows), His2Av810 heterozygous GSC (arrowhead) and hub (star). Scale bar: 25 µm (B): Percentage of testes with His2Av810 (red) or His2Av810, UAS-E-Cad-GFP (blue) GSCs scored at indicated times after clonal induction. Data shows average ± S.D.(C–D′): Immunostaining of testes 3 days after clonal induction with anti-©-tubulin (red) and anti-GFP (green) in His2Av810 (C–C′) and FRT control (D–D′) GSCs. Centrosomes of GFP negative GSCs (arrows), heterozygous GFP-positive GSCs (arrowheads) and hub (yellow dashed line). Scale bars: 10 µm (E): Percentage of oriented (blue) and misoriented (red) centrosomes in His2Av810 mutant, His2Av810 heterozygous, and FRT 82B control GSCs. (F–G′″): Immunostaining of His2Av810/+ testes (F–F′″) 5 days PCI with anti-GFP (green), anti-STAT92E (red) and anti-Fas3 and TJ (blue) and STAT92E06346/+ testes (G–G′″) 3 days PCI with anti-GFP (green), anti-His2Av (red) and anti-Fas3 and TJ (blue). DAPI (F′″) in white. His2Av810 (F–F′″) and STAT92E06346 (G–G′″) mutant GSCs (arrows), His2Av810 (F–F′″) and STAT92E06346 (G–G′″) heterozygous GSCs (arrowhead) and hub (yellow dashed line). Scale bar: 12.5 µm (F) and 10 µm (G). (H–I″″): Larval testes expressing Upd under the nanos-Gal4 driver and either heterozygous for His2Av (H–H″″) or mutant for His2Av (I–I″″) immunostained with anti-Zfh-1 (H, I, green), anti-Vasa (H′, I′, red), anti-Arm and anti-spectrin (H″, I″, blue and H″″, I″″) and counterstained with DAPI (H′″, I′″). H″″ and I″″ are magnifications of the regions enclosed in H″ and I″, respectively. Dot fusomes (arrows) and branched spectrosomes (arrowhead). Scale bar: 100 µm.

