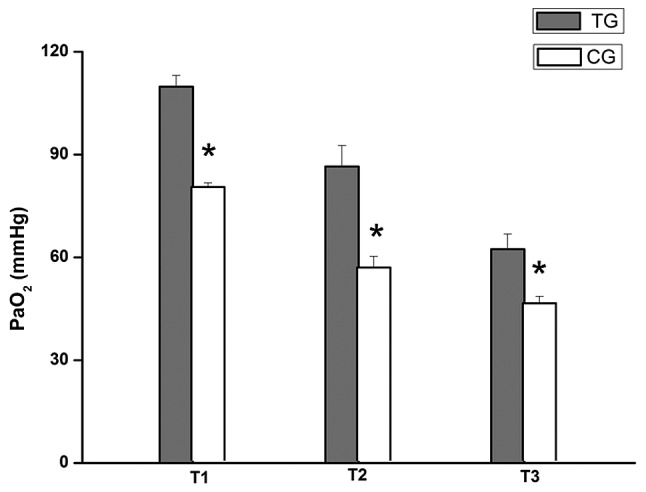
Figure 3.

Comparison of PaO2 between the two groups. PaO2 was measured at the indicated time-points using a blood gas analyzer. PaO2 in the TG was higher compared with that in the CG at T1, T2 and T3. *P<0.001 vs. TG rats. TG, treatment group; CG, control group; T1, 30 min after ligating; T2, 30 min after reperfusion; T3, 60 min after reperfusion; PaO2, arterial partial pressure of oxygen.
