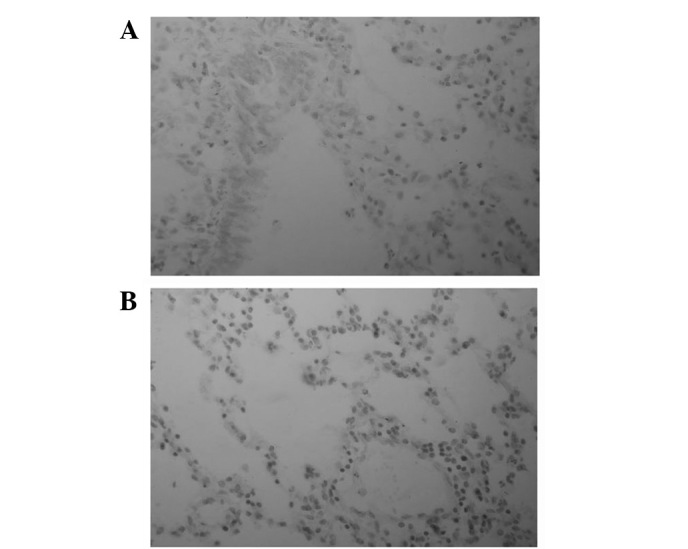
Figure 5.

Comparison of the expression of ICAM-1 (immunohistochemical staining; magnification, ×400). (A) Expression of ICAM-1 in lung tissue at T2 in TG rats. (B) Expression of ICAM-1 in lung tissue at T2 in CG rats. The level of positive expression of ICAM-1 protein in the TG was lower compared with that in the CG at T1, T2 and T3. T1, 30 min after ligating; T2, 30 min after reperfusion; T3, 60 min after reperfusion; TG, treatment group; CG, control group; ICAM-1, inflammatory cell adhesion molecule-1.
