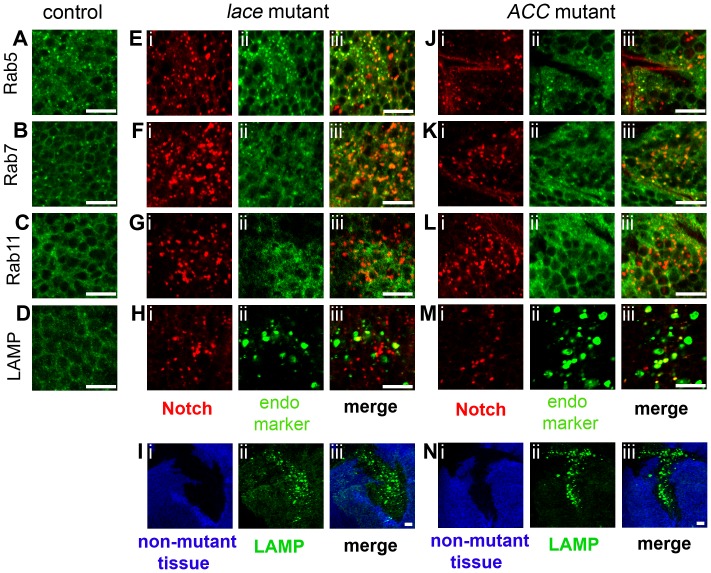
Figure 4. Colocalization of Notch with endosomal and lysosomal markers in lace and ACC mutant tissue clones.
Each confocal image triplet (i–iii) depicts lace2 (E–I) or ACC1 (J–N) mutant wing disc clones, showing Notch overaccumulation (red in i for E–H, J–M) or mutant clone locations (absence of blue signal in i for I and N), the subcellular localization of the indicated organelle marker (green in ii), and the corresponding merged images at right (iii). Corresponding wildtype control images for each marker are shown in A–D; da-GAL4; UAS-Rab5-YFP, Rab7-YFP, or Rab11-YFP and UAS-LAMP-HRP were utilized for controls. Organelle markers in each panel are as follows: Rab5-YFP (Rab5; A, E, J), Rab7-YFP (Rab7; B, F, K), Rab11-YFP (Rab11; C, G, L), and LAMP-HRP (LAMP; D, H, I, M, N). Note elevated LAMP-HRP expression in lace2 and ACC1 mutant clones in I and N. Scale bars, 10 µm.

