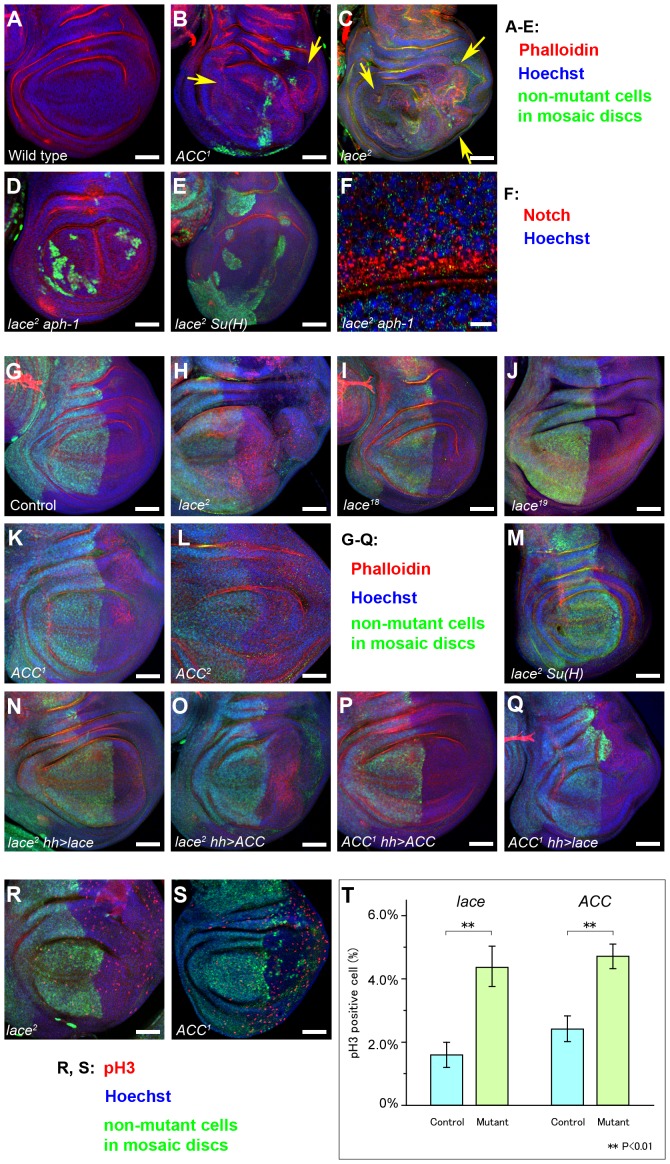
Figure 5. Analysis of tissue overgrowth and cell proliferation in lace and ACC mutant cells.
Confocal images of wing disc pouches corresponding to (A) wildtype, (B) ACC1 mutant clones, (C) lace2 mutant clones (arrows indicate tissue overgrowth regions in B and C), (D) lace2 aph-1D35 double mutant clones, and (E) lace2 Su(H)k07904 double mutant clones, with confocal signals for Hoechst (blue), Phalloidin (red) and Myc (green) staining used to reveal tissue architecture and mutant vs. wildtype cell territories in clone-bearing discs. (F) Confocal section of a lace2 aph-1D35 clone, showing high vesicular Notch accumulation (red). Hoechst-stained nuclei are shown in blue; faint green signal represents Myc antibody background staining that was used to identify the Myc-negative clones. (G–S) Mutant clones encompassing the wing posterior compartment were induced using the hh-GAL4; UAS-FLP system for (G) the control wildtype genotype (FRT40A FRTG13), (H, N, O, R) lace2, (I) lace18, (J) lace19, (K, P, Q, S) ACC1, (L) ACC2, and (M) lace2 Su(H)k07904. (N–Q) UAS-cDNA constructs encoding wildtype LaceHA (N, Q) or ACC (O, P) were expressed in either lace2 (N, O) or ACC1 (P, Q) mutant clones as indicated. Discs in G–Q were examined for Myc expression to identify Myc-negative clone regions (lack of green signal), Phalloidin (red), and Hoechst (blue). Genotypes of each panel correspond to those listed in Supplemental Table S3. (R, S) Wing imaginal discs with lace2 (R) or ACC1 (S) posterior compartment clones were analyzed with anti-phosphohistone H3 antibody (pH 3; red), anti-Myc (green; clone marker as above), and Hoechst (blue). Genotypes of (R) and (S) are the same as (H) and (K), respectively. (T) The percentages of pH 3-positive nuclei in lace2 or ACC1 homozygous mutant cells compared to control heterozygous cells were determined by analyzing Myc-negative and Myc-positive 127 µm×127 µm sectors, respectively, for ten discs of each genotype (**; P<0.01 by t-test). Scale bars, 50 µm in A–E, G–S; 10 µm in F.

