
Figure 2.
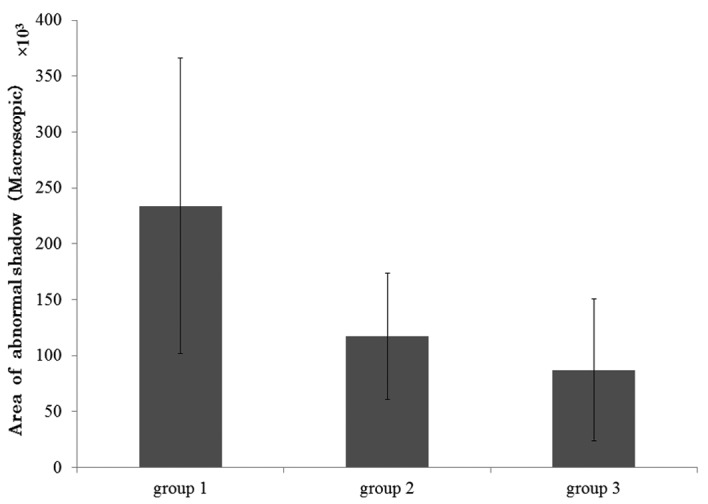
Size of abnormal area in macroscopic specimens. The largest macroscopic abnormal area in the pathological specimens was in group 1, followed by groups 2 and 3. There was a significant difference between groups 1 and 3 (P<0.05) and a marked difference between groups 1 and 2 (P= 0.09). Moreover, there was no significant difference between groups 2 and 3. Group 1, control; group 2, monotherapy with pirfenidone; group 3, triple therapy with pirfenidone, edaravone and erythropoietin.