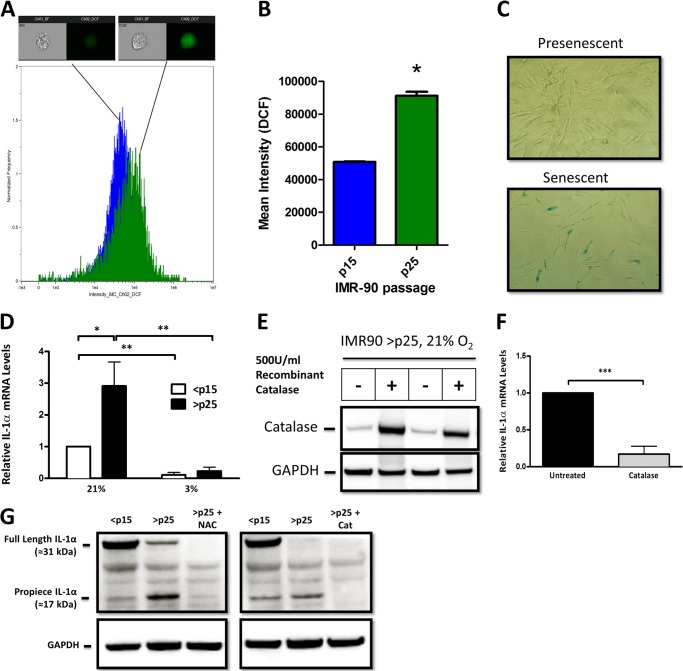
FIGURE 1.
SA IL-1α expression is regulated by cellular H2O2. A, histogram of data obtained using an ImageStreamX flow cytometer to investigate the fluorescence intensity of the reactive oxygen species-sensitive dye H2DCFDA in IMR-90 cells. Presenescent (<p15; n = 8070) and senescent (>p25; n = 3458) cells were quantified for DCF intensity. One representative image is shown from the bin corresponding to the mean intensity of the 505–560-nm emission channel for each population. Positive DCF staining is shown in green in the cell image inlay. Mean fluorescent values for cells treated with H2DCFDA were normalized to control DCF-treated values for <p15 and >p25 cells. B, bar graph of the ImageStreamX data. The IDEAS software program was used to calculate the mean intensity of the DCF signal for each sample, and the results are plotted with error bars that represent S.D. C, SA β-galactosidase staining in presenescent (<p15) and senescent (>p25) IMR-90 fibroblasts cultured in 21% O2. D, quantitative real-time PCR (qRT-PCR) of the IL-1α transcript from presenescent (<p15) and senescent (>p25) IMR-90 fibroblasts cultured in 21 or 3% O2. E, Western blot analysis of intracellular catalase after overnight incubation with 500 units/ml recombinant catalase added to cell culture medium. GAPDH was used as a loading control. F, qRT-PCR of the IL-1α transcript from senescent cells with and without 500 units/ml recombinant catalase. G, Western blot analysis of IL-1α protein using an antibody directed against an N-terminal epitope (amino acids 2–112) in <p15 and >p25 cells. N-Acetyl-l-cysteine (NAC) was used at a concentration of 2 mm, and recombinant catalase (Cat) was used at 500 units/ml. Data represent n ≥ 3. *, p ≤ 0.05; **, p ≤ 0.01; ***, p ≤ 0.001.

