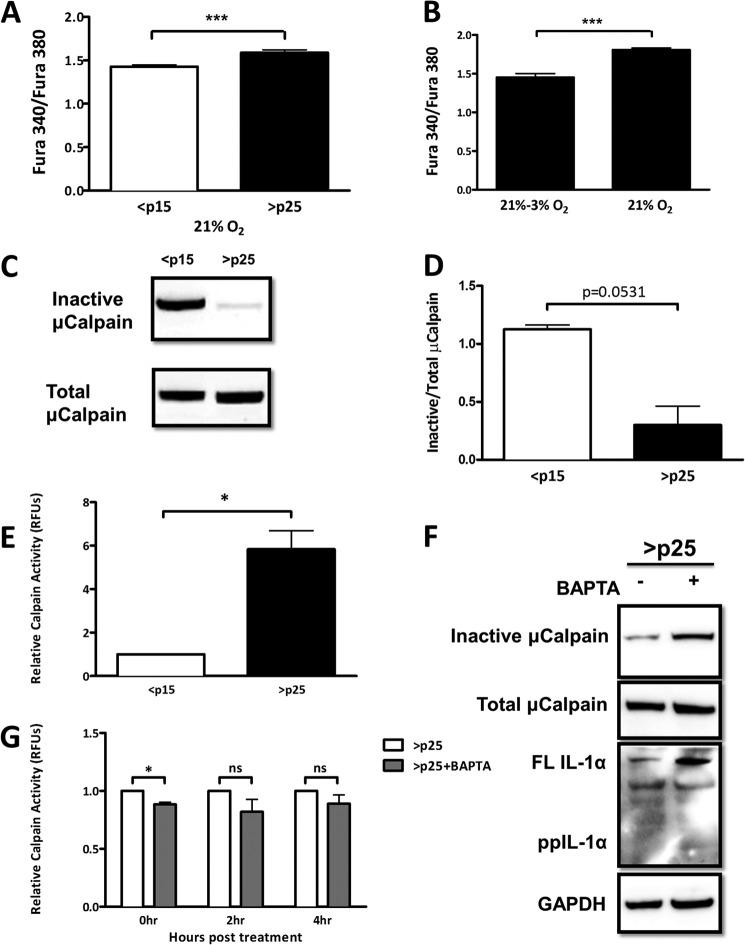
FIGURE 2.
SA shifts in intracellular Ca2+ activate calpain and promote IL-1α processing. A, ratiometric Ca2+ imaging of presenescent (<p15) and senescent (>p25) primary IMR-90 fibroblasts. B, ratiometric Ca2+ imaging of senescent (>p25) IMR-90 fibroblasts maintained at 21% oxygen tension or moved to 3% oxygen tension. Cells were assayed 1 week after changing the oxygen tension. C, Western blot analysis of inactive and total μ-calpain in presenescent and senescent cells. D, quantification of C. E, calpain activity measured using fluorescently labeled substrate in presenescent (<p15) and senescent (>p25) primary IMR-90 fibroblasts. RFU, relative fluorescence units. F, Western blot analysis of inactive and total μ-calpain and IL-1α in senescent cells 6 h post-treatment with and without 3 μm BAPTA-AM (pulsed for 1 h). FL IL-1α, full-length IL-1α; ppIL-1α, IL-1α propiece. G, calpain activity measured using fluorescently labeled substrates in senescent cells with and without 3 μm BAPTA-AM (pulsed for 1 h) at the indicated times post-treatment. Data represent n ≥ 3. *, p ≤ 0.05; ***, p ≤ 0.001; ns, not significant.

