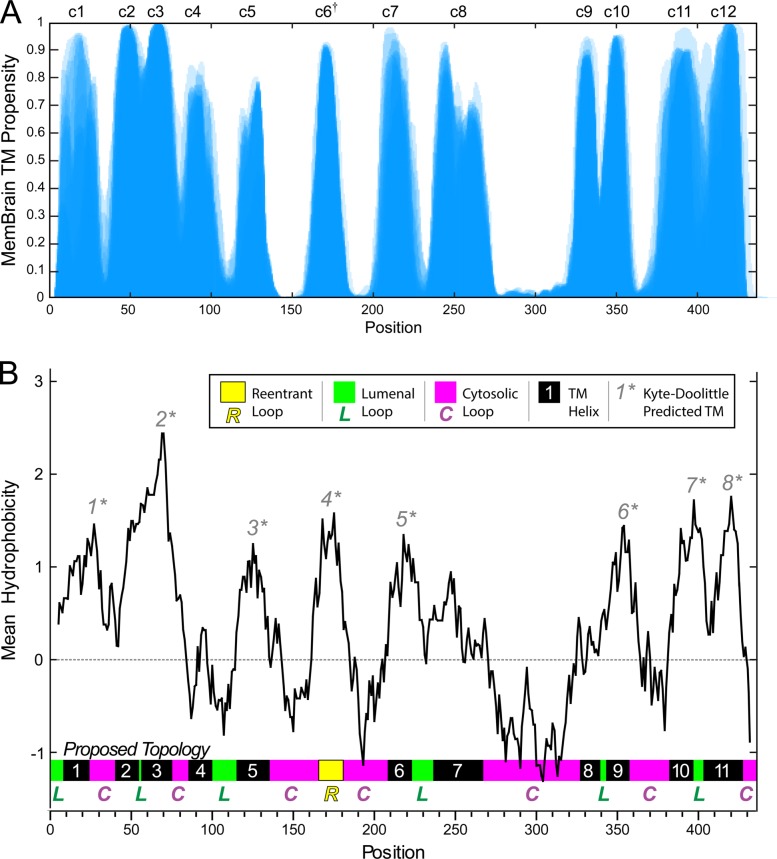
FIGURE 2.
Comparison of new versus prior GOAT topology models. A, aligned overlay of MemBrain helical propensities by position for GOAT from 16 species. A darker color indicates a more consistent prediction. Candidate TMs are labeled c1–c12 at the top. †, candidate TM-6 was found to be non-TM. B, Kyte and Doolittle mean hydrophobicity profile for mouse GOAT, with an 18-residue scan window. *, TMs predicted by this method are shown above the hydrophobic peaks. Our proposed topology of GOAT is shown in the thick bar at the bottom of the graph, with TMs in black, lumenal loops in green, cytosolic loops in pink, and a possible reentrant loop in yellow.

