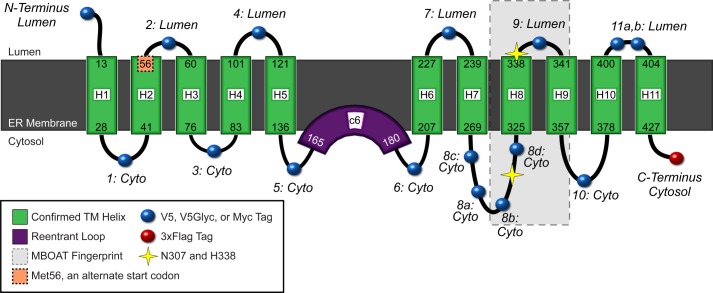
FIGURE 7.
GOAT topology model as an 11-TM protein with one reentrant loop. Confirmed TMs are shown in green, spanning the ER membrane (gray). The lumen is above, and cytosol is below. We suggest that the hydrophobic region of GOAT c6, predicted to be a TM domain, may be a reentrant loop, shown in purple. Relative loop length is shown by the size of the loops (black lines), but they are not precisely scaled. Variable epitope tag positions used are shown as blue spheres; the constant C-terminal 3xFLAG tag is a red sphere. The alternate translational start site (Met-56) is highlighted in orange. Positions of the two conserved MBOAT residues (Asn-307 and His-338 in mouse and human GOAT) are shown as yellow stars, and the most conserved region across all MBOATs is shown as a gray box (approximately from Arg-303 to Met-354 in GOAT, from pfam03062 (20)). The figure design is modified from the output of MEMSAT-SVM, with permission.

