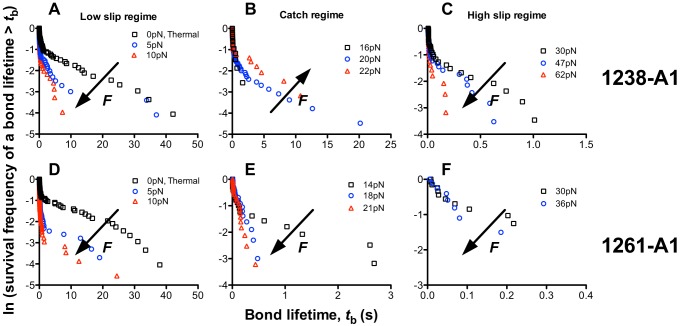
FIGURE 6.
Bond lifetime distributions. Survival frequencies, calculated as the fraction of measurements (including both short and long lifetime events) with a bond lifetime >tb, were plotted versus tb for each force bin in each of three regimes: low (A and D), intermediate (B and E), and high (C and F) forces, for GPIbα bonds with 1238-A1 (A–C) and 1261-A1 (D–F). These forces corresponded to the low slip bond, the catch bond, and the high slip bond regime for 1238-A1 interactions, but 1261-A1 interactions only showed slip bonds in the entire force regime. The arrows indicate the directions of force increase.

