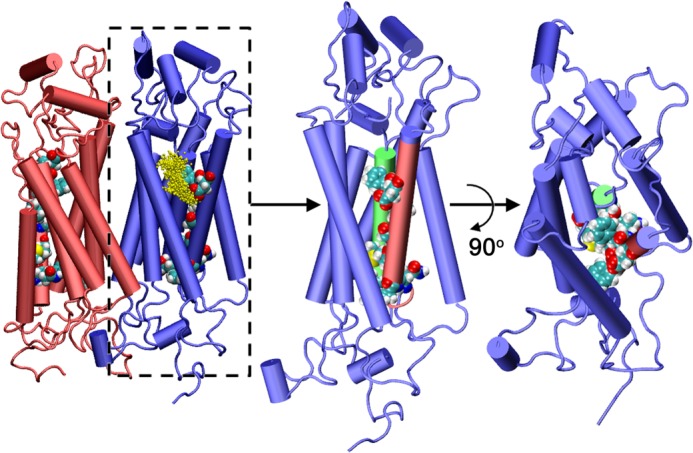
FIGURE 8.

Representative structure of hASBT dimeric assembly obtained from explicit MD simulations. The lipid bilayer and solvent environment have been omitted for clarity. Sodium distribution in one of the monomers captured from the MD simulations is also shown. The side view and top view of one the monomer is presented to highlight the arrangement of the amino acids involved in the proposed TM2-TM3 translocation pathway. Representation: protein, new schematic representation; sodium ions, CPK representation; amino acids in TM2 and TM3, VDW representation. The figure was generated using molecular graphics package VMD (21).
