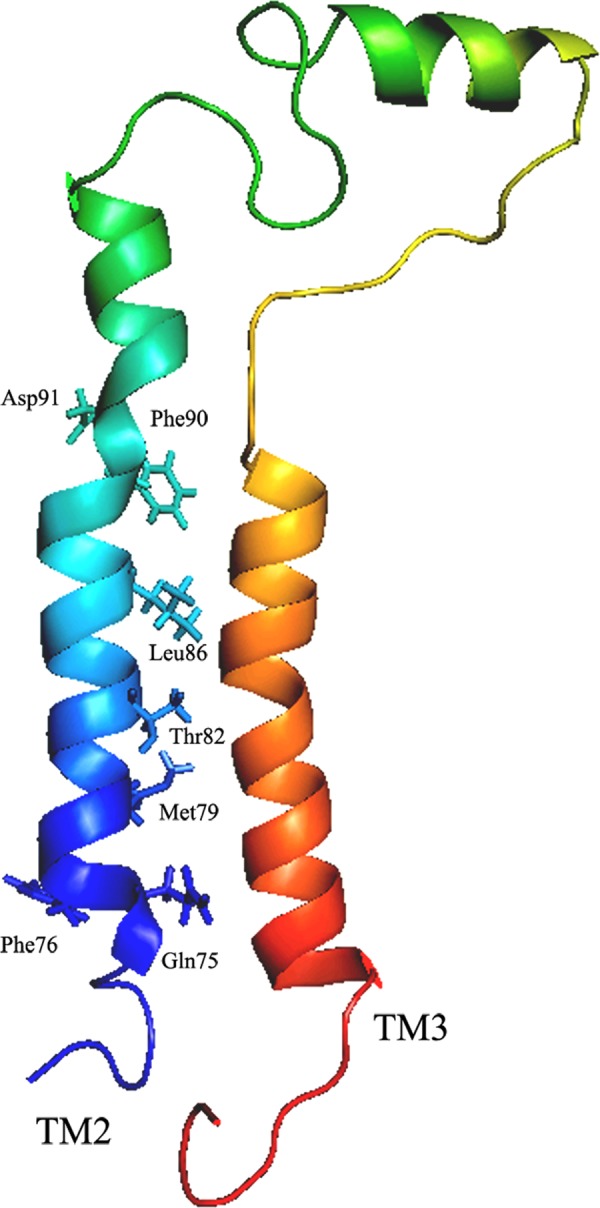
FIGURE 9.

In silico rendering of the residues relevant for sodium transport. The relative orientation of the TM2 and TM3 in dimer model is depicted. The residues that show sodium sensitivities from TM2 are highlighted. Amino acids are represented by their three-letter codes and corresponding placement in the protein.
