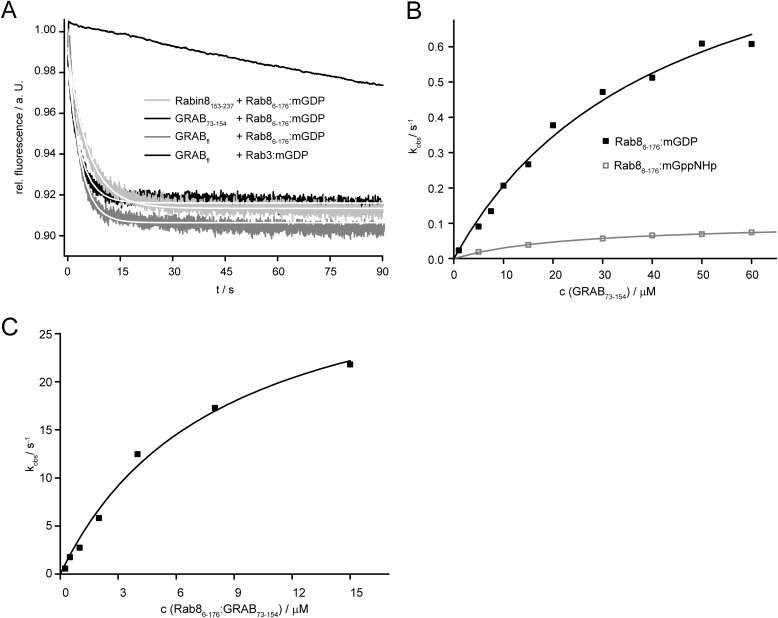
FIGURE 1.
Kinetic analysis of the Rab8-GRAB interaction. A, comparison of full-length GRAB (GRABfl) GEF activity with the GRAB and Rabin8 GEF domains (10 μm) interacting with Rab8·mant-GDP (mGDP) in the presence of 100 μm GDP. Rab3·mant-GDP did not interact with full-length GRAB (10 μm). rel., relative; a. U., arbitrary units. B, dependence of the observed rate constant of mant-GDP/mant-GppNHp release from Rab8 on the concentration of GRAB. Plots of the observed rate constants for mant-GDP (black squares)/mant-GppNHp (gray squares) were hyperbolic. Fitting the hyperbolic curve leads to the values for KD3 and k″−4. C, dependence of the observed rate constants for the association reaction on the concentration of nucleotide-free Rab8·GRAB complex.

