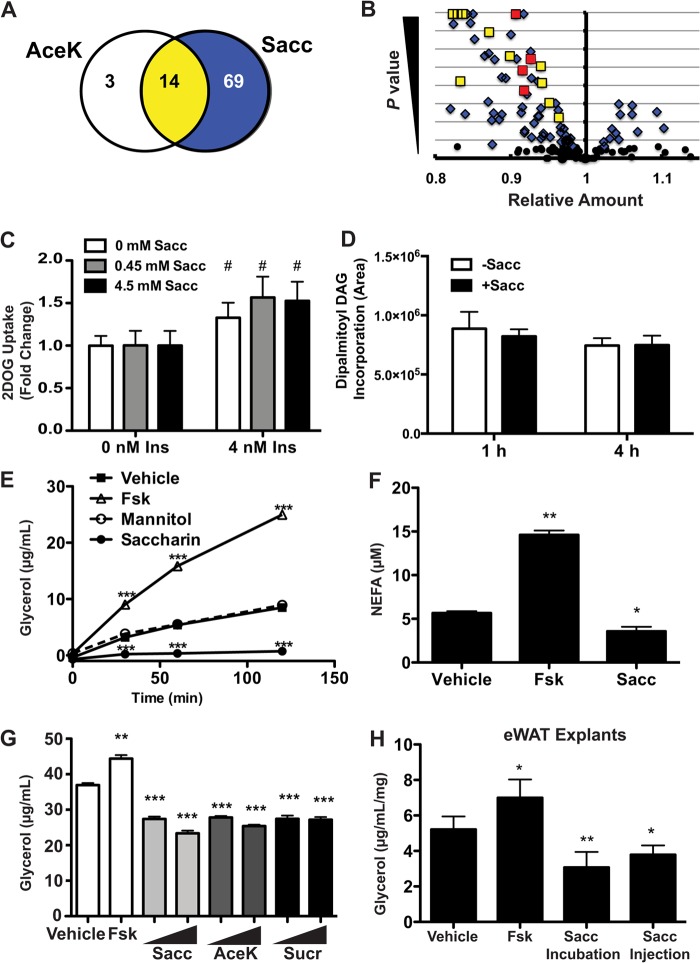
FIGURE 7.
Artificial sweeteners suppress lipolysis. A, following 1-h Sacc or AceK treatment, 3T3-L1 adipocytes were flash frozen, and intracellular metabolites were evaluated on an LC-MS platform by the University of Michigan Molecular Phenotyping Core. Of the metabolites that were significantly altered by the treatment, 69 were unique to Sacc, three were unique to AceK, and 14 were shared between both sweeteners. B, distribution of metabolites altered by Sacc alone (blue) or Sacc and AceK (yellow) following 1-h treatment in 3T3-L1 adipocytes. Long-chain fatty acids decreased by both saccharin and AceK are shown in red. The significance level on the y axis extends to 10e−16. C, glucose uptake was measured in 3T3-L1 adipocytes as described under “Materials and Methods.” Significant differences (p < 0.05) between 0 and 4 nm insulin are denoted with #. D, incorporation of [13C]palmitate into dipalmitoyl diacylglycerol (DAG) with 1 or 4 h of 4.5 mm Sacc treatment in 3T3-L1 adipocytes. E, 3T3-L1 adipocytes were serum-starved for 2 h in HBSS before treatment with 4.5 mm Sacc, 4.5 mm mannitol, or 10 μm Fsk. Glycerol content of the medium was assayed at the indicated time points. F, non-esterified fatty acid (NEFA) (μm) was measured from assay medium after 60 min of 4.5 mm Sacc treatment. G, glycerol content of assay medium was measured following 1-h treatment with Sacc, AceK, or sucralose (Sucr) at 0.45 and 4.5 mm. H, epididymal white adipose tissue (eWAT) explants were collected from C57BL/6J mice 20 min following injection of Sacc. Glycerol content of the medium was then measured following a 4-h incubation with vehicle, Fsk, or Sacc. Significant differences from vehicle treatment p < 0.05, p < 0.01, and p < 0.005 are denoted with *, **, and ***, respectively. Data are expressed as mean ± S.D. (error bars). Significance was determined using Student's t test. 2DOG, 2-deoxyglucose.

