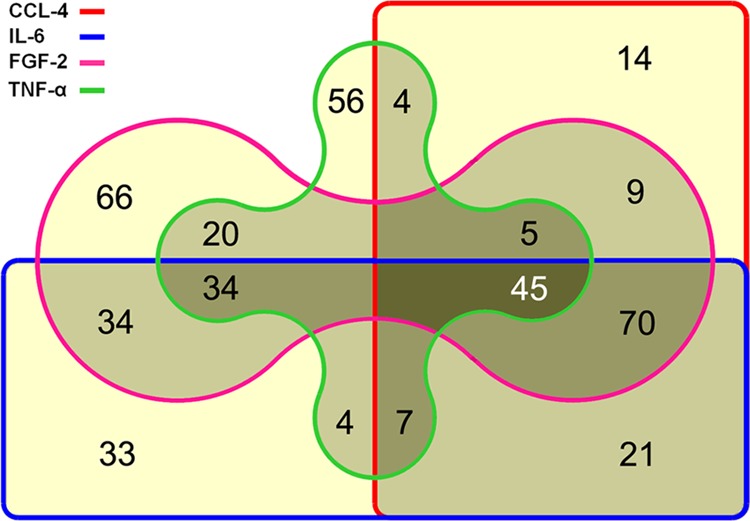
FIGURE 1.

Venn diagram showing the number of proteins that were found regulated upon growth of PSCs in the presence of TNF-α, CCL-4, IL-6, and FGF-2. A yellow background indicates the number of proteins uniquely regulated at one condition only. Light gray and medium gray stand for molecules that were regulated at two or three growth conditions, respectively. The number of proteins that were differentially expressed under all four conditions is shown in the area with the darkest background.
