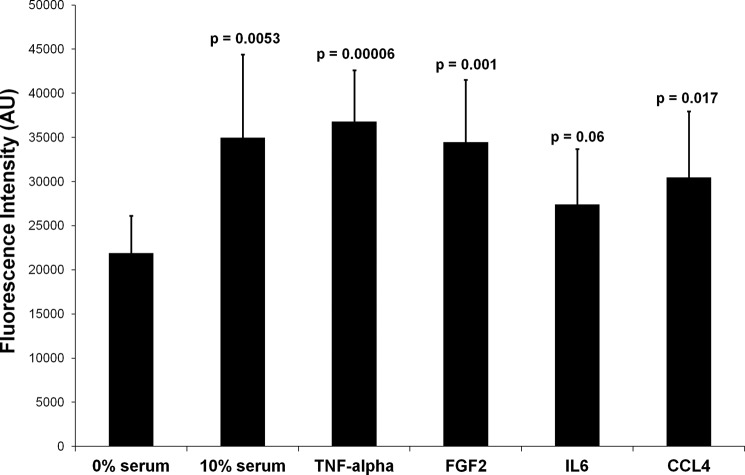
FIGURE 6.
Proliferation of PSCs under various incubation conditions. The assay measured the incorporation of a fluorescent dye to the DNA that was proportional to the number of cells in the system. The fluorescence intensities are shown in arbitrary units (AU). The p values were calculated in comparison with the control cells grown in serum-free medium.

