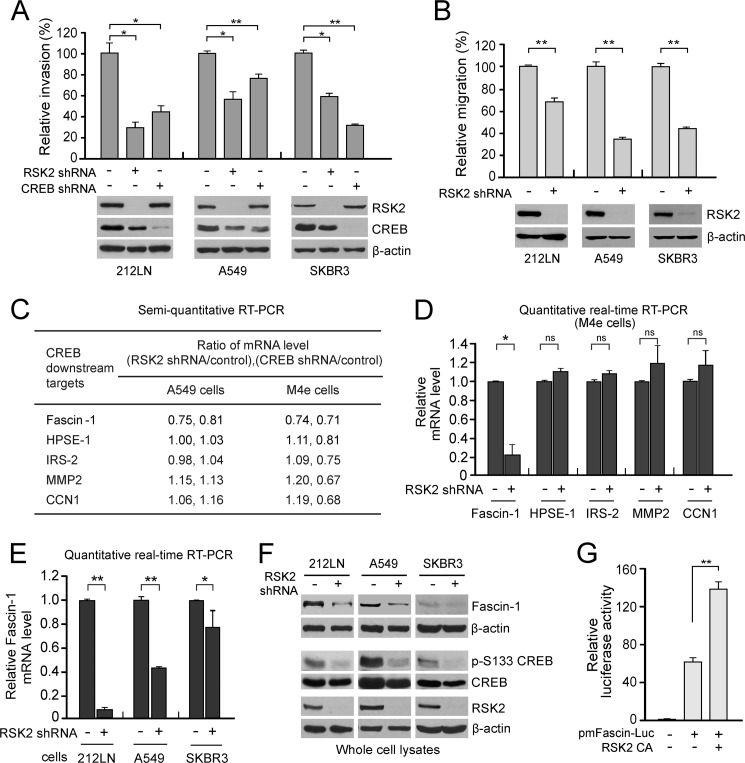
FIGURE 1.
RSK2 activates CREB to promote cancer cell invasion and migration by up-regulating proinvasive Fascin-1. A, stable knockdown of RSK2 or CREB by shRNA (lower panels) results in significantly decreased invasion (upper panels) in the metastatic cell line HNSCC 212LN (left), the lung cancer cell line A549 (middle) and the breast cancer cell line SKBR3 (right). B, stable knockdown of RSK2 in 212LN, A549, and SKBR3 cells decreases cancer cell migration in a collagen-based migration assay. C, a summary of RT-PCR results detecting mRNA levels of a group of CREB transcription targets in metastatic lung cancer A549 and HNSCC M4e cells with a stable knockdown of RSK2 or CREB. One-step RT-PCR was performed using specific primers. The mRNA level of each transcription target was calculated as the signal intensity of each target band normalized to its relevant GAPDH band on agarose gels. The number indicates the mRNA ratio of each target in A549 and M4e cells with either RSK2 knockdown or CREB knockdown to the control cells with an empty vector. D, real-time RT-PCR results show that RSK2 knockdown results in decreased mRNA levels of the prometastatic CREB downstream target, Fascin-1 but not other CREB transcription targets in M4e cells. E, real-time RT-PCR results show that RSK2 knockdown results in decreased mRNA levels of Fascin-1 in various metastatic human cancer cells. F, knockdown of RSK2 resulted in attenuated Ser-133 phosphorylation of CREB, as well as attenuated protein expression levels of Fascin-1 in highly invasive 212LN, A549, and SKBR3 cells. G, RSK2 activates the fascin-1 gene promoter in a luciferase reporter assay. The Fascin-1 promoter-reporter construct and a plasmid containing the constitutively active mutant form of RSK2,Y707A (RSK2 CA) were co-transfected into 293T cells. After 24 h, cells were collected and assayed for luciferase expression. The results are shown as the firefly luciferase activity corrected for the Renilla luciferase activity in the cell lysate, in RSK2 CA-stimulated versus control cells and are expressed as the fold induction. All of the error bars shown in the figures represent the mean values ± S.D. from three replicates of each sample. p values were determined using Student's t test (*, p = 0.01–0.05; **, p < 0.01). The Western blot data presented are from one experiment that is representative of multiple independent experiments.

