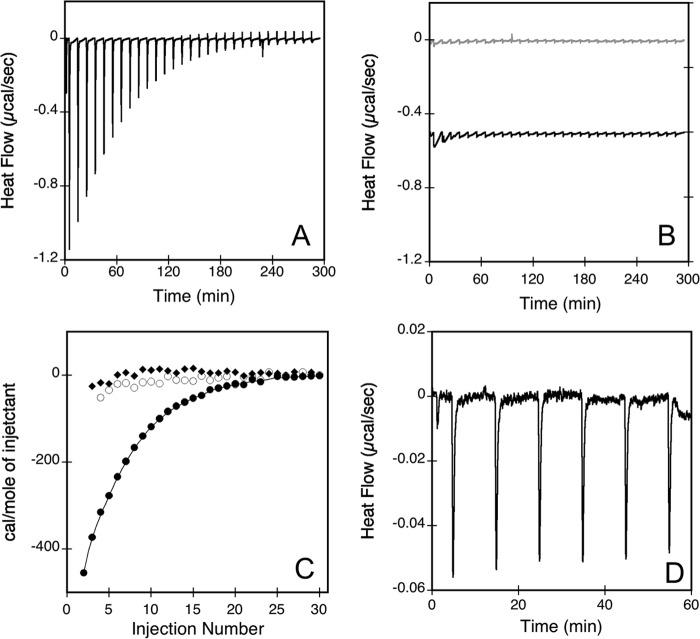
FIGURE 2.
Isothermal titration calorimetry of peptide membrane partition. The heat flow traces show the calorimetric titrations of P454 (A) and P414 (B, gray traces) by consecutive injections of negatively charged SUVs (DOPC/DOPE/DOPG/Chol, 4:3:2:1). B also shows the heat flow produced by injections of neutral SUVs (DOPC/DOPE/Chol, 6:3:1) into P454 (black traces; offset −0.5 μcal/s in the figure for a better visualization). Each peak corresponds to the injection of 5 μl of 20 mm SUVs into the ITC reaction cell containing 1.41 ml of 42 μm peptide in buffer B at 25 °C. C, integrated binding isotherm of P454 with negative SUVs (filled circles) or with neutral SUVs (empty circles) and P414 with negative SUVs (filled squares). D, heat flow trace of anionic SUVs titrated by a solution of P454. Each peak corresponds to the injection of 5 μl of 85 μm P454 into the ITC reaction cell containing 1.41 ml of 5 mm anionic SUVs in buffer B at 25 °C. Thermodynamic parameters are reported in supplemental Table S2.

