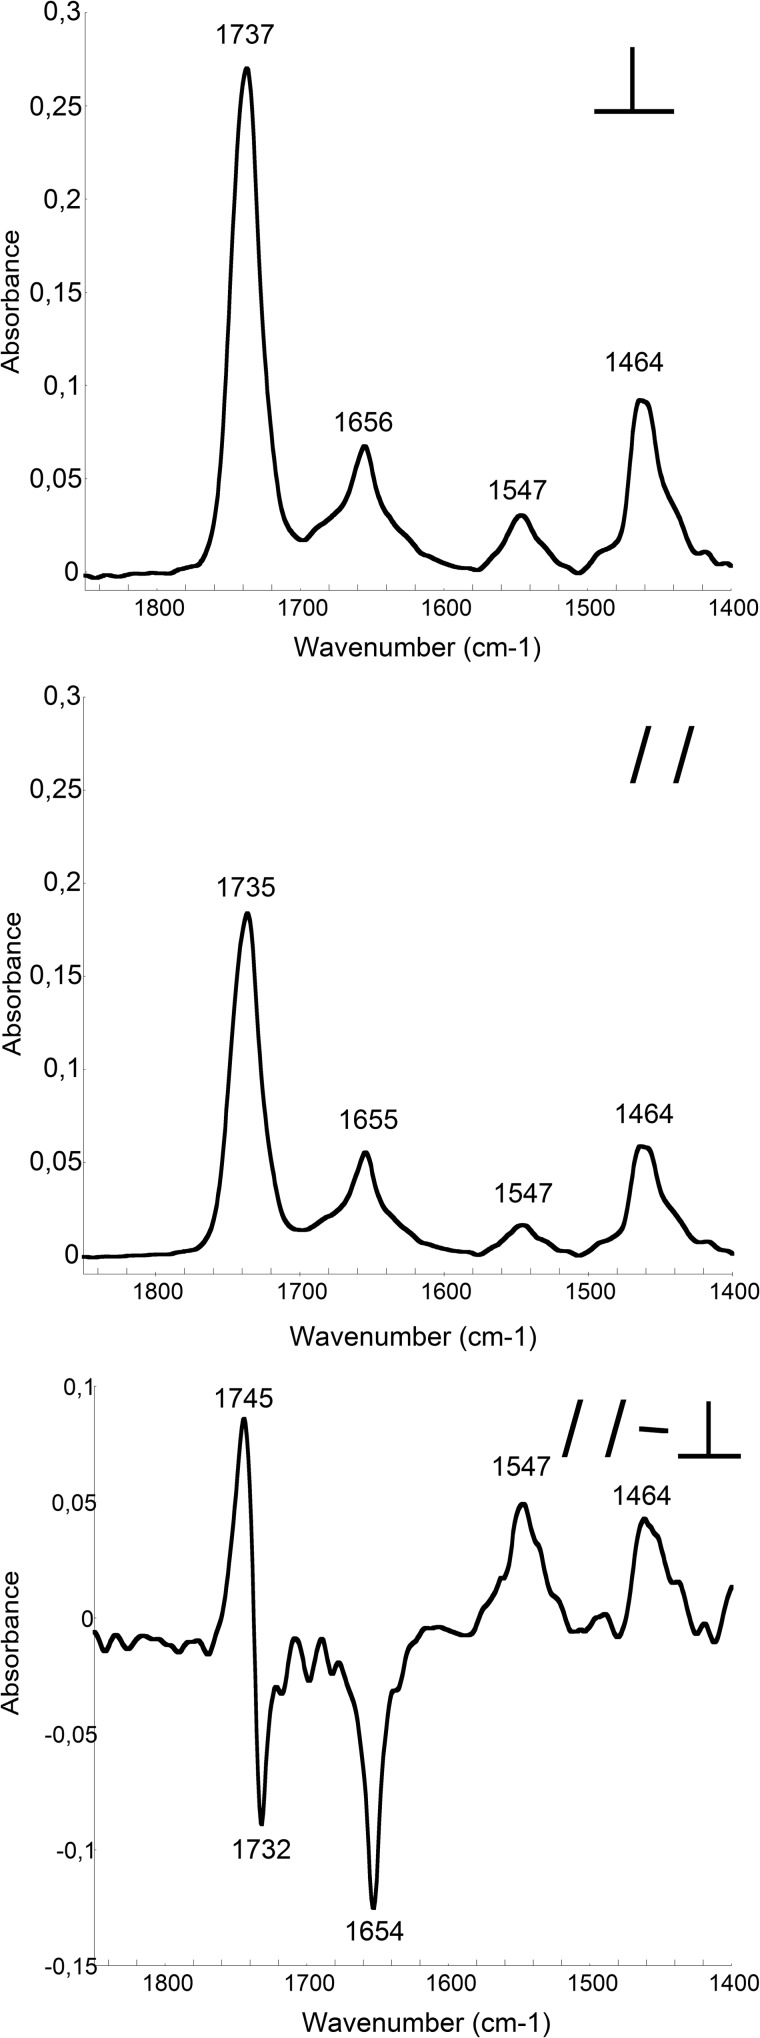
FIGURE 4.
ATR-FTIR spectra of P454. The ATR-FTIR spectra of P454 mixed with lipids (DOPC/DOPE/DOPG/cholesterol, 4:3:2:1) were recorded with perpendicular (top) or parallel (middle) polarization of the infrared light. The resulting dichroic spectrum of P454 in membranes (bottom) is multiplied by a scaling factor of 8 for convenience (see “Materials and Methods”). The S.D. value is within 5%. Secondary structure content analysis is reported in supplemental Table S4.

