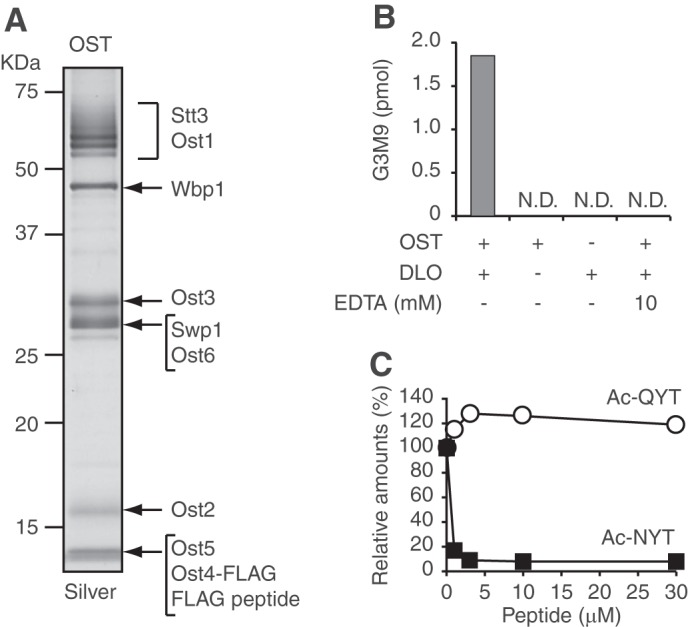
FIGURE 4.

The purified OST complex generates fOSs directly from DLOs. A, SDS-PAGE of the purified OST complex (1.5 pmol), followed by silver staining. The migration positions of OST subunits were predicted based on previous reports (42, 43). B, in vitro fOS generation assay. OST, DLOs, and EDTA were incubated for 24 h in combinations as indicated at the bottom of the graph. After the reaction, the generated Glc3Man9GlcNAc2 oligosaccharide (G3M9) was quantitated. N.D., not detected. C, competition assay using acceptor and non-acceptor peptides. OST was incubated with DLOs in the presence or absence of various concentrations of Ac-NYT and Ac-QYT for 24 h. The amounts of G3M9 generated in the absence of the peptide were set to 100%. Closed squares, Ac-NYT; open circles, Ac-QYT.
