
FIGURE 6.
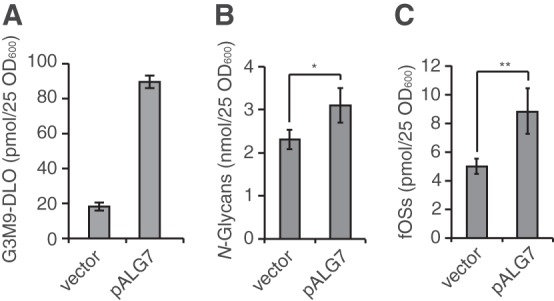
The generation of fOSs by OST is a tightly regulated process. Quantitation of Glc3Man9GlcNAc2-PP-Dol (G3M9-DLO) (A), total N-glycans (B), and total fOSs (C) in png1Δ ams1Δ cells carrying either the empty vector (vector) or the plasmid encoding ALG7 (pALG7). Error bars indicate the range of two independent experiments (A) and S.D. from three (B) or five (C) independent experiments. *, p = 0.04; **, p = 0.001 (Student's t test).