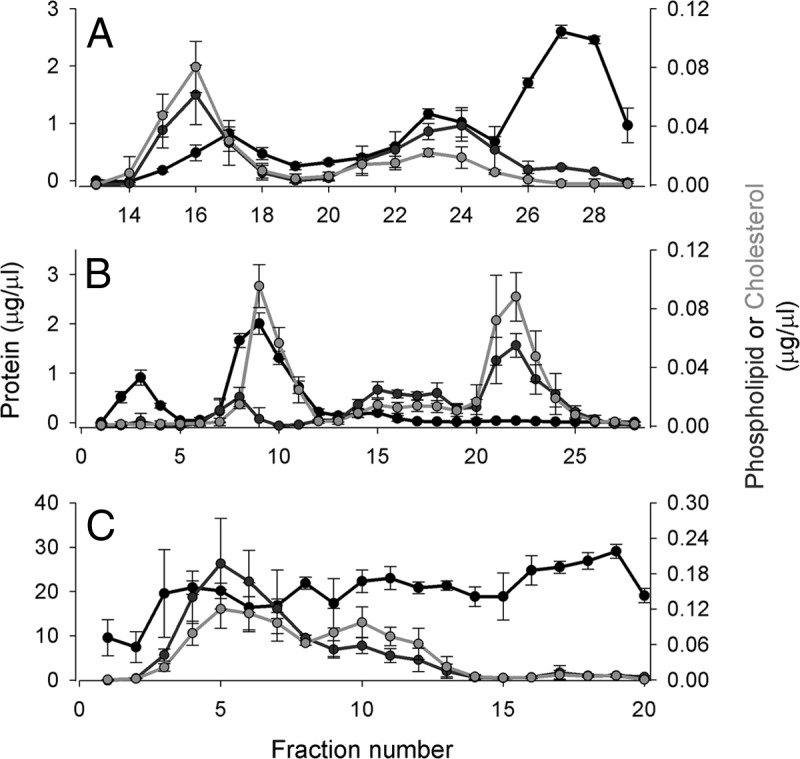
Fig. 2.

Phospholipid, total cholesterol, and total protein distribution across fractions from each separation technique. A, gel filtration chromatography on three Superdex 200 columns arranged in series (1.5-ml fractions). Fractions 1–12 are not shown as they represent the void volume of the column where no lipid or protein signal was detected. B, anion exchange chromatography on a MonoQ column (1.5-ml fractions). C, preparative isoelectric focusing on a Rotofor apparatus (Bio-Rad) using ampholytes from pH 5–7 (1.5-ml fractions). Fraction 1 represents the anode (+, or low-pH) end of the gradient, and fraction 20 is the cathode (−, or high-pH). For each separation, the total protein determined by colorimetric assay (see “Experimental Procedures”) is in black, the total cholesterol is in green, and choline-containing phospholipids are in red. The concentration listed reflects that in the fraction, not in plasma. The data show three independent separations on three normal plasma donors, and the error bars represent ±1 sample standard deviation.
