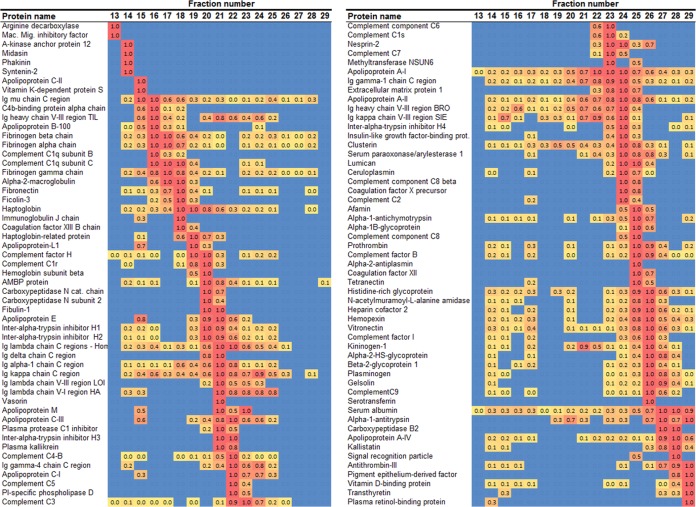
Fig. 4.
Heat map of protein distribution patterns as determined via gel filtration chromatography. Fraction numbers are indicated across the top. The proteins identified with this method (n = 3 donors) are listed on the left. Equal volumes of each fraction were applied to the CSH resin, trypsinized, and then isolated via MS. The spectral counts (i.e. the number of unique peptides identified for each protein) were determined for each protein in each fraction. The fraction that contained the highest peptide count for a given protein was normalized to 1, and all other fractions for that protein were scaled accordingly. The highest relative values are colored red and gradate to yellow for the lowest values (blue indicates that no peptides were found). The proteins were ordered from largest to smallest based on the peak fraction. No determination can be made about the relative abundance of different proteins from this analysis. All proteins indentified via this method are shown.

