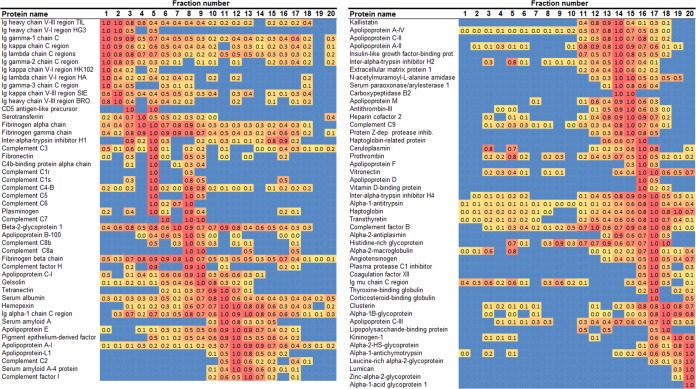
Fig. 6.
Heat map of protein distribution patterns as determined via preparative isoelectric focusing. The figure is laid out exactly as for Fig. 4 except that the proteins are ordered from lowest to highest isoelectric point (pI) based on the peak fraction. All proteins identified with this method are shown.

