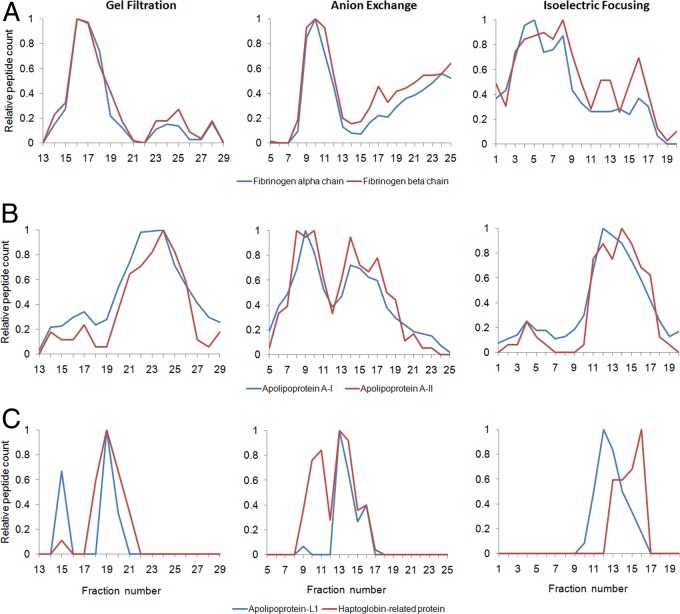
Fig. 7.
Examples of co-migration patterns across the three separation techniques. The normalized peptide counts (same numbers shown in the heat maps in Figs. 4–6) have been plotted across the fractions for each separation technique for select protein pairs determined to have a high co-separation score. A, fibrinogen α-chain (blue) and fibrinogen β-chain (red). B, ApoA-I (blue) and apoA-II (red). C, ApoL-I (blue) and haptoglobin-related protein (red) (i.e. previously known components of trypanosome lytic factor (see text)). Data are averages from three donors. Error bars were not included for clarity.

