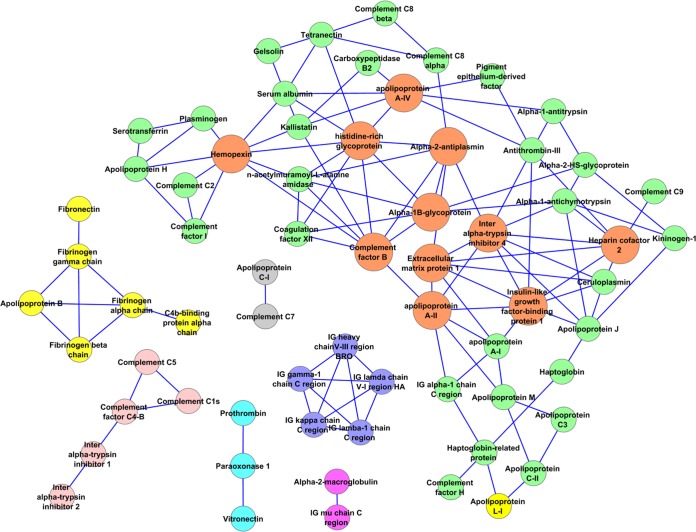
Fig. 8.
Network of the top-scoring pairs identified in this analysis. The protein pairs scoring in the top 3% (80 proteins with composite scores above 1.80) are shown as a network as represented by the Cytoscape software package using the organic layout (43). Network “hubs” that exhibit seven or more connections to other proteins are shown in orange. Other subnetworks are shown in distinct colors.

