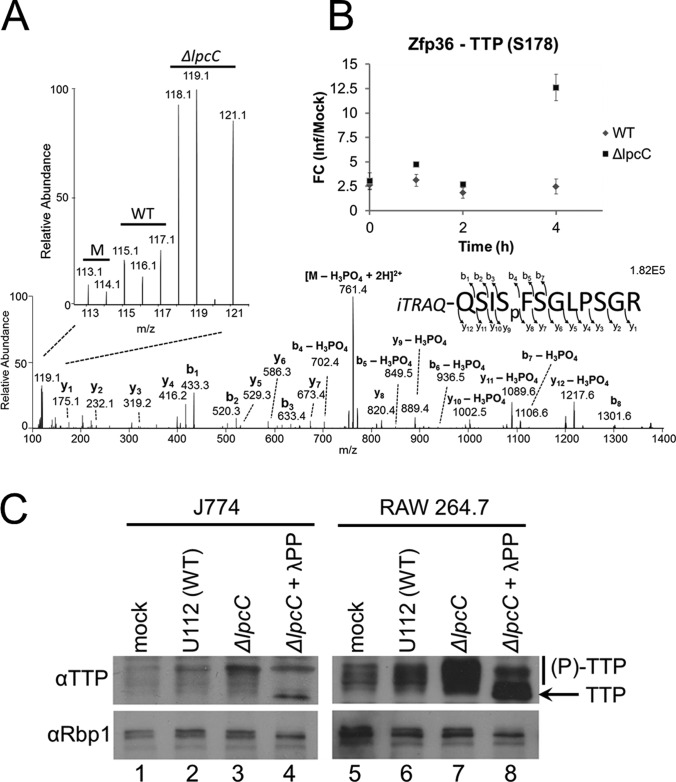
Fig. 6.
Dynamics of TTP phosphorylation in RAW 264. 7 cells during Francisella infection. A, Tandem mass spectrum illustrating the identification and quantification of the phosphopeptide QSISpFSGLPSGR (corresponding to phosphorylation at serine 178) from tristetraprolin (Zfp36 or TTP) at 4 h postinfection. The expanded region highlights the iTRAQ report ions used for quantification. B, Time course quantification of TTP phosphorylation at serine 178. C, Western blot analysis of J774 and RAW 264.7 cell lines 4 h post infection with WT or ΔlpcC F. novicida. The presence of phosphorylation on TTP was determined by shift of electrophoretic mobility on treatment with λ-phosphatase (λPP).

