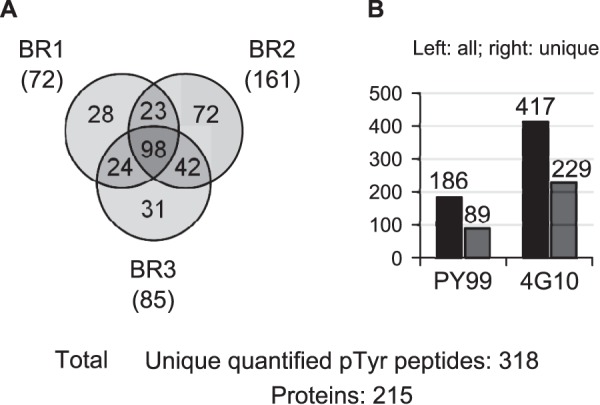
Fig. 4.

Identified and quantitated Tyr-phosphorylated peptides. A, overlap between the three biological replicates. Peptides unique to a biological replicate (keeping the highest Mascot score candidate) are indicated between brackets. B, distribution among agarose-conjugate resins used for peptide pTyr IPs. Left-hand and right-hand bars represent all and unique peptides, respectively.
