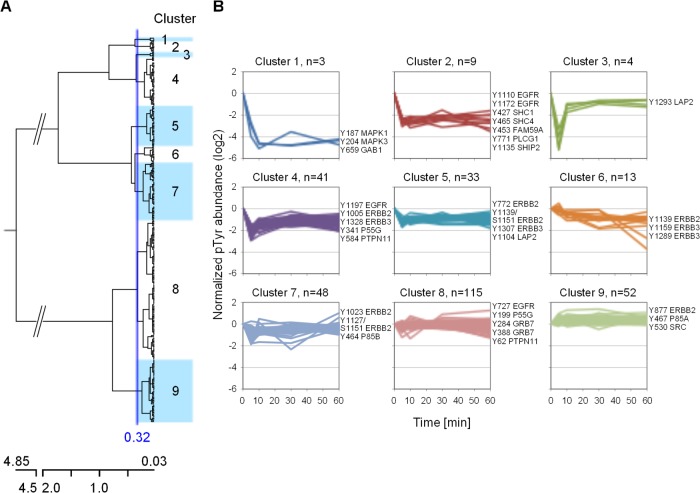
Fig. 5.
Hierarchical clustering of phosphotyrosine time profiles. A, dendogram of the 318 time profiles obtained using Euclidean distance and Ward's linkage criterion. The distance threshold was set at 0.32, resulting in nine clusters. B, phosphorylation time profile distribution of the nine individual clusters. The numbers of profiles belonging to each cluster and selected phosphorylation sites are indicated.

