
Fig. 4.
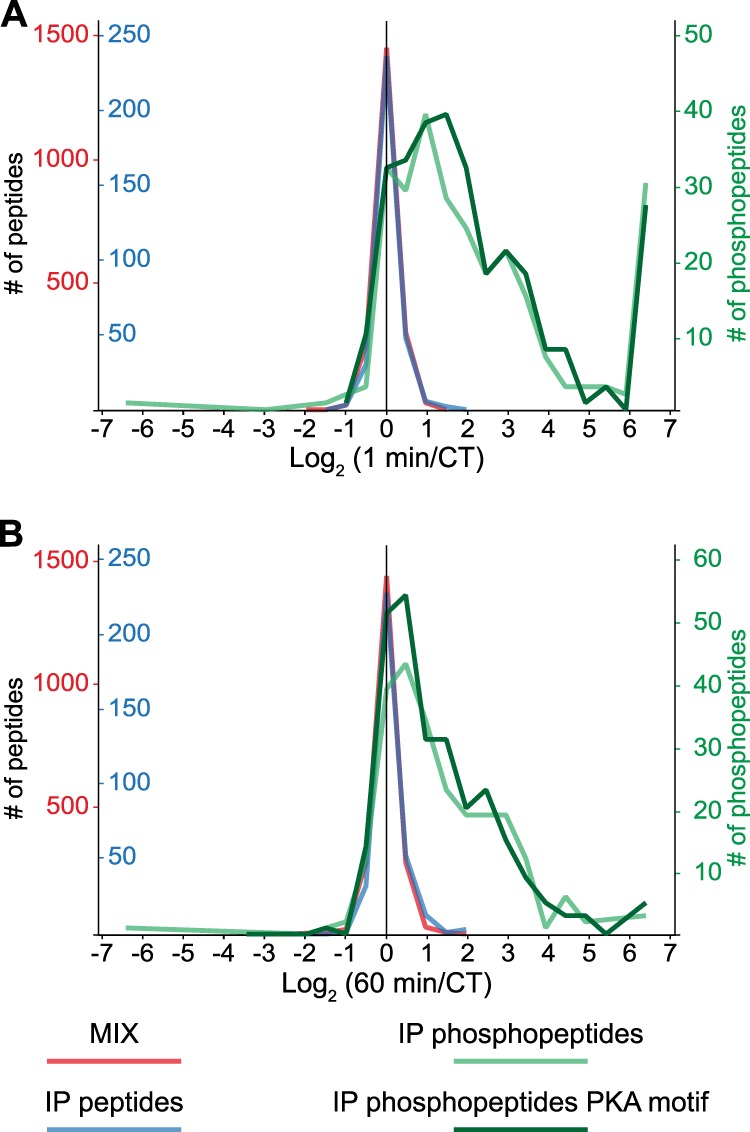
Quantitative analysis of the PGE2-regulated phosphoproteome. Density curves of observed peptide ratios before (MIX) and after (IP) the immunoprecipitation show that the three differentially stable-isotope dimethyl-labeled samples were mixed as 1:1:1, with negligible nonphosphopeptides with a large dimethyl ratio between stimulated and unstimulated cells. Density curves of the quantified phosphopeptides, with or without a localized putative PKA motif, show a general increase in the level of phosphorylation upon PGE2 stimulation after 1 min (A) and 60 min (B).